Açıklama
GENEL BAKIŞ
Bu gösterge, Alfred François Tagher'ın Şubat 2024 sayısında Technical Analysis of Stocks & Commodities dergisinde yayımlanan "Fiyat ve Zaman Filtrelemesi ile Trend Tanımlama" metodolojisini uygular.
Kavram, piyasa gürültüsünü azaltmak ve sürdürülebilir trendleri belirlemek için fiyat hareketini zaman bazlı filtreleme ile birleştirir. Gösterge, her fiyat hareketine tepki vermek yerine, sadece fiyat önceki dönemin aralığının ötesinde kapanış yaptığında trend yönünü değiştirir—bu durum, rastgele dalgalanma yerine gerçek momentum sinyali verir.
TEMEL KURALLAR
Orijinal kurallar basittir:
- Dönemin kapanışı önceki dönemin yüksek seviyesini aşarsa → trend YUKARI
- Dönemin kapanışı önceki dönemin düşük seviyesinin altındaysa → trend AŞAĞI
- Bir dönüşüm koşulu gerçekleşene kadar trend değişmez
Bu yaklaşım, önceki dönemin aralığında kalan küçük fiyat hareketlerini filtreler ve sadece kararlılığı gösteren kırılmalara odaklanır.
NASIL ÇALIŞIR
Gösterge, mevcut zaman diliminin kapanışını seçilen daha yüksek zaman diliminin önceki dönem yüksek ve düşük seviyeleri ile karşılaştırır:
- Trend Yukarı: Mevcut kapanış > Önceki dönem yüksek seviyesi
- Trend Aşağı: Mevcut kapanış < Önceki dönem düşük seviyesi
- Değişiklik Yok: Kapanış önceki dönemin aralığında kalır
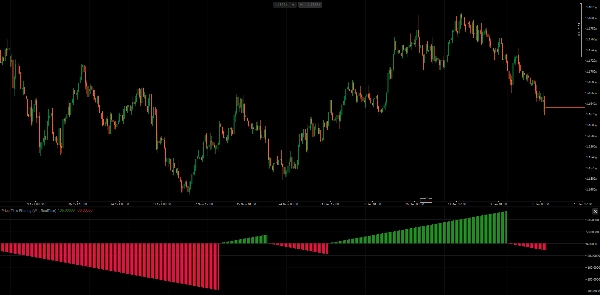
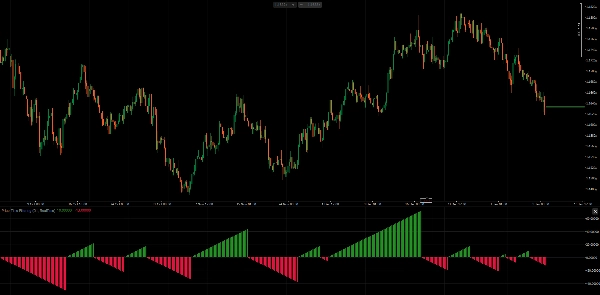
Histogram, mevcut trend yönündeki barların sürekli sayımını gösterir—yukarı trendler için pozitif değerler, aşağı trendler için negatif değerler. Bu, hem trend yönünü hem de süresini görselleştirir.
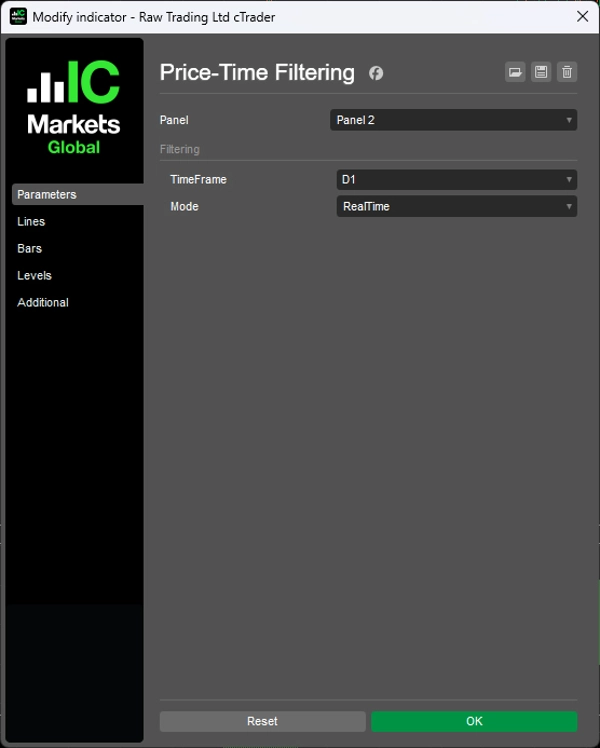
FİLTRELEME MODLARI
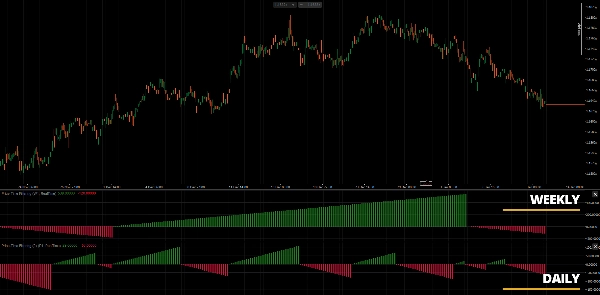
1. PeriodEnd Modu Daha yüksek zaman dilimi dönemi tamamlandığında trendi değerlendirir. Bu, haftalık trendin Cuma kapanışıyla (veya aylık için ay sonu kapanışıyla) belirlendiği orijinal metodolojiye uygundur. Daha stabil, daha az sinyal.
2. RealTime Modu Her bar üzerinde, mevcut kapanışı önceki dönemin aralığına karşı değerlendirir. Daha erken sinyaller sağlar ancak dönemde daha fazla gürültü üretebilir.
PARAMETRELER
- Zaman Dilimi: Trend değerlendirmesi için daha yüksek zaman dilimi (örneğin, Haftalık, Aylık)
- Mod: PeriodEnd (orijinal metodoloji) veya RealTime (daha duyarlı varyant)
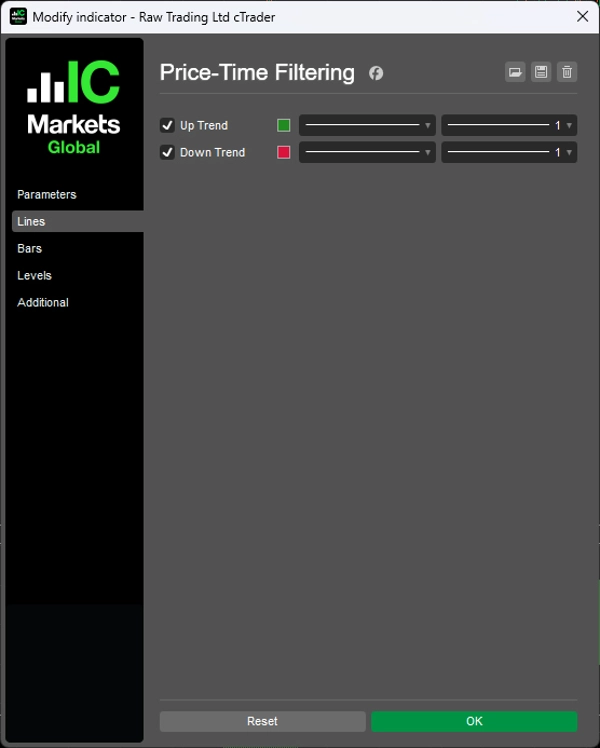
YORUMLAMA
- Yeşil histogram: Devam eden yukarı trend, bar sayısı süresini gösterir
- Kırmızı histogram: Devam eden aşağı trend, bar sayısı süresini gösterir
- Histogram sıfırlaması: Trend dönüşümü gerçekleşti
Gösterge, orijinal makalede açıklandığı gibi, Haftalık veya Aylık zaman dilimi seçimi ile günlük grafiklerde en iyi şekilde çalışır. Ancak uygulama herhangi bir zaman dilimi kombinasyonunu destekler.
NOTLAR
- Orijinal olarak haftalık/aylık değerlendirme ile günlük grafikler için tasarlanmıştır
- Seçilen zaman dilimi grafik zaman diliminden yüksek olduğu her zaman dilimi kombinasyonunda çalışır
- Bar sayısı, trend olgunluğunun bir ölçüsünü sağlar—uzun sayımlar yerleşik trendleri gösterir
- Giriş zamanlaması için fiyat yapısı analizi ile birleştirmeyi düşünün
KAYNAKÇA
Tagher, Alfred François. "Trend Identification By Price And Time Filtering." Technical Analysis of Stocks & Commodities, Şubat 2024.
__________________________________________________________________________________________
DAHA FAZLA ÜCRETSİZ GÖSTERGE
Yapı ve hacimden regresyon, volatilite ve özel zaman dilimlerine kadar geniş bir piyasa analiz araçları yelpazesini keşfedin.
Kaynak kodu GitHub deposunda mevcuttur.
Tamamen ücretsizdir. Ancak kahve desteği göndermek isterseniz, buradan yönlendirebilirsiniz.
Destek/Direnç
Hacim
- Hacim Aktivite Profili
- Hacim Verimlilik Analizörü
- Hacim Profili Analitiği
- Hacim Profili - Güncellenmiş
- Hacim Yayılım Analizi
- VWAP (Hacim Ağırlıklı Ortalama Fiyat)
Hareketli Ortalamalar
- SSL Kanalı
- Çapa Hareketli Ortalama
- Sapma Ölçekli Hareketli Ortalama
- Gann Yüksek Düşük Aktivatörü
- Anlık Trend Çizgisi
- Trend Vizyonlu Kaufman Adaptif HO
- Hareketli Ortalama Kanalı
- Hareketli Ortalamalar Paketi
- Trend Kanalı Hareketli Ortalaması
Araçlar/Özel
Regresyon Tabanlı
Volatilite
Osilatörler
__________________________________________________________________________________________
FERAGATNAME
Ticaret risk içerir. Bu gösterge sadece teknik analiz amaçlıdır — her zaman uygun risk yönetimi uygulayın ve sorumlu şekilde işlem yapın.
GERİ BİLDİRİM & GELİŞTİRMELER
Önerileriniz, özellik talepleriniz veya geliştirme fikirleriniz varsa, lütfen Tartışma sekmesinde yorum bırakın. Geri bildiriminiz, göstergenin herkes için geliştirilmesine yardımcı olur.
Özet
The indicator supports two filtering modes: PeriodEnd mode, which evaluates trends only at the close of a higher timeframe period (e.g., weekly or monthly), providing more stable signals; and RealTime mode, which updates trend status on every bar for more responsive but potentially noisier signals. Users can select the higher timeframe for trend evaluation, typically weekly or monthly, while applying the indicator on lower timeframe charts.
A histogram visually represents trend direction and duration, with positive values and green bars indicating uptrends, negative values and red bars indicating downtrends, and resets marking trend reversals. The indicator is applicable across various markets including Forex, indices, commodities, crypto, and stocks, and supports any timeframe combination where the selected higher timeframe exceeds the chart timeframe.