Candle Pro
Chỉ báo
121 lượt tải
Phiên bản 1.0, Oct 2025
Windows, Mac
5.0
Đánh giá: 1
Mô tả
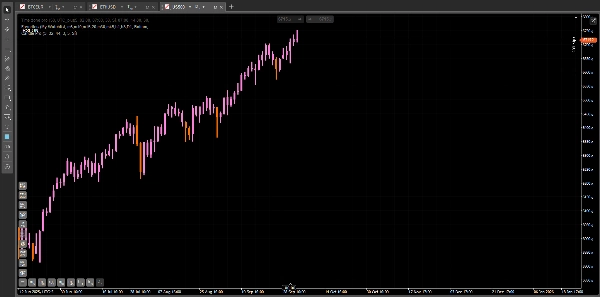
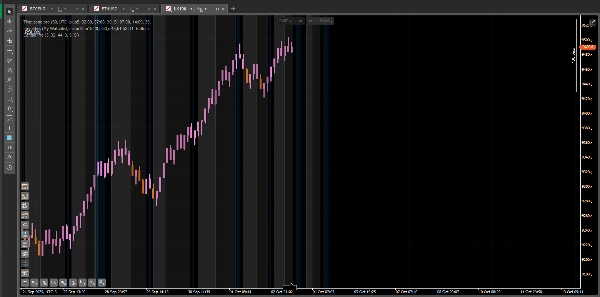
Candle Pro – Tín hiệu RSI trực quan trên nến
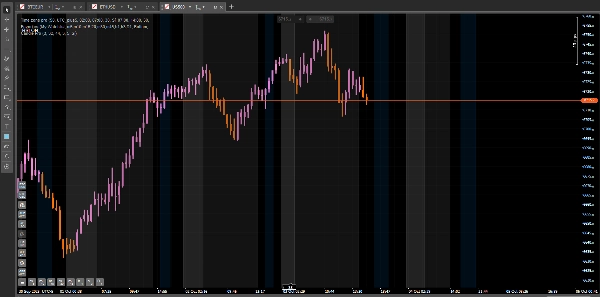
Candle Pro là một chỉ báo làm nổi bật các cây nến trực tiếp trên biểu đồ khi RSI đạt mức quá mua hoặc quá bán, giúp bạn tập trung vào hành động giá và tránh các biểu đồ phụ không cần thiết.
🧭 Cách sử dụng
- Thêm chỉ báo vào biểu đồ của bạn.
- Điều chỉnh các tham số RSI phù hợp với phong cách giao dịch của bạn.
- Quan sát cách các cây nến đổi màu ở các mức cực đoan, đánh dấu các vùng đảo chiều hoặc động lực tiềm năng.
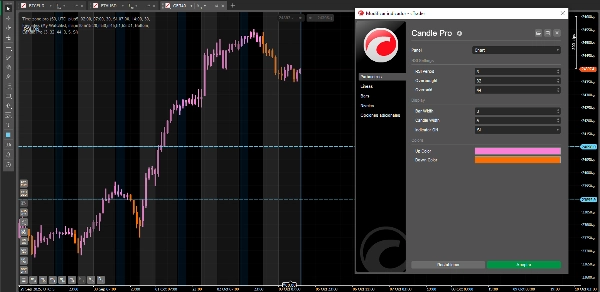
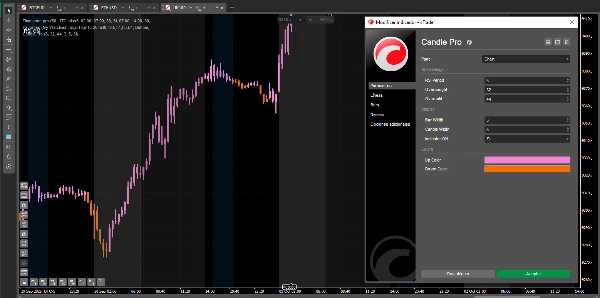
⚙️ Cài đặt đề xuất
Để có phản ứng nhanh và chính xác:
- Chu kỳ RSI: 3
- Quá mua: 32
- Quá bán: 44
- Chiều rộng nến: 3
- Chiều rộng thanh: 1
✨ Lợi ích
- Tín hiệu trực quan rõ ràng ngay trên giá.
- Hoạt động với mọi ký hiệu và khung thời gian.
- Màu sắc và độ rộng đường hoàn toàn có thể tùy chỉnh.
- Hoàn hảo cho scalping, giao dịch trong ngày, và giao dịch swing.
Lưu ý: Đây là phiên bản miễn phí của Candle Pro. Một phiên bản cao cấp sẽ sớm ra mắt, với các tính năng độc quyền giúp nâng tầm giao dịch của bạn.
Tóm tắt
Tóm tắt AI
Candle Pro is a trading indicator designed to visually highlight RSI (Relative Strength Index) signals directly on price candles, eliminating the need for separate RSI sub-charts. It marks candles on the chart when RSI reaches overbought or oversold levels, helping traders identify potential reversal or momentum zones. Users can customize RSI parameters, candle colors, and line widths to suit their trading style. The indicator supports any symbol and timeframe, making it suitable for scalping, intraday, and swing trading strategies. Suggested settings include an RSI period of 3, overbought level at 32, and oversold level at 44 for fast and precise signals. Candle Pro emphasizes clean visual cues integrated with price action to maintain chart clarity. This version is the free edition, with a premium version planned to offer additional features. Supported markets include Forex, Indices, and Crypto.
Hồ sơ chỉ báo
Đánh giá của khách hàng
5.0
Đánh giá: 1
5 | 100 % | |
4 | 0 % | |
3 | 0 % | |
2 | 0 % | |
1 | 0 % |
Đánh giá của khách hàng
November 3, 2025
This is an interesting indicator it really helps to filter out market noise. Thanks
Thảo luận
Câu hỏi thường gặp
Forex
Indices
RSI
Crypto
Các sản phẩm có sẵn trên cTrader Store, bao gồm bot giao dịch, chỉ báo và plugin, được cung cấp bởi các nhà phát triển bên thứ ba và chỉ nhằm mục đích cung cấp thông tin và tiếp cận kỹ thuật. cTrader Store không phải là nhà môi giới và không cung cấp lời khuyên đầu tư, khuyến nghị cá nhân hay bất kỳ đảm bảo nào về hiệu suất trong tương lai.


Giá
Kể từ 24/02/2025
15
Lượt bán
1.84K
Cài đặt miễn phí