
Description
Pressure Scanner 🔍📊
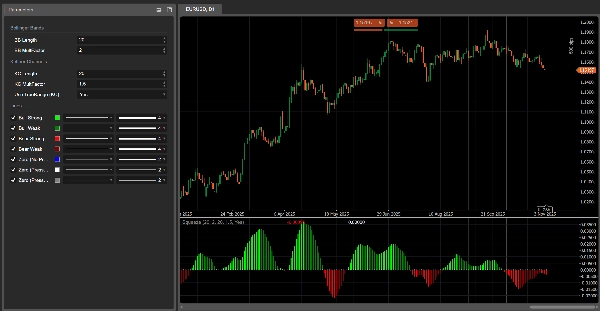
1. Ce que fait Pressure Scanner
Pressure Scanner est un outil de volatilité et de direction qui :
- détecte quand le marché est sous pression / compression de volatilité ✅
- montre quand cette pression est libérée en expansion 💥
- mesure la direction et la force de la poussée de prix résultante via une valeur scanner tracée sous forme d'histogramme.
Il combine :
- une bande de prix de type Bollinger,
- un canal de volatilité de type Keltner,
- et une ligne scanner basée sur la régression linéaire,
pour afficher à la fois les états de pression (activée / libérée / neutre) et l'impulsion directionnelle (vers le haut ou vers le bas).
2. Comment ça fonctionne (logique)
- Source
L'indicateur utilise le prix de clôture comme entrée principale. - Bande de volatilité externe (style BB)
-
- Base = SMA(close,
BB Length) - Déviation =
KC MultFactor× écart-type de close - Bande supérieure = base + déviation
- Bande inférieure = base − déviation
- Base = SMA(close,
- Canal de volatilité interne (style KC)
-
- Centre = SMA(close,
KC Length) - Plage = soit True Range soit High−Low (défini par
Use TrueRange) - Moyenne de la plage = SMA(plage,
KC Length) - Canal supérieur = centre + rangeAvg ×
KC MultFactor - Canal inférieur = centre − rangeAvg ×
KC MultFactor
- Centre = SMA(close,
- États de pression
En comparant la bande externe et le canal interne : -
- Pression ACTIVÉE – points noirs à zéro
-
- Bande inférieure > canal inférieur et bande supérieure < canal supérieur
- La bande est entièrement à l'intérieur du canal → la volatilité est compressée, forte pression.
- Pression LIBÉRÉE – points gris à zéro
-
- Bande inférieure < canal inférieur et bande supérieure > canal supérieur
- La bande est entièrement à l'extérieur du canal → la volatilité est en expansion après pression.
- Pression neutre – points bleus à zéro
-
- Toute autre configuration.
- Valeur scanner (
val)
L'histogramme montre une valeur scanner calculée via une régression linéaire : -
- Sur les
KC Lengthdernières barres, l'indicateur trouve : -
- plus haut plus haut,
- plus bas plus bas,
- SMA de la clôture.
- Il construit une ligne médiane dynamique :
-
- rangeMid = (plus haut + plus bas) / 2
- combinedMid = moyenne(rangeMid, SMA(close))
- Puis il définit :
scannerInput=close−combinedMid\text{scannerInput} = \text{close} - \text{combinedMid}scannerInput=close−combinedMid - Une régression linéaire sur
KC Lengthbarres est effectuée sur cettescannerInput, et la valeur finale à la dernière barre est la valeur scannerval.
- Sur les
Interprétation :
val > 0→ le prix pousse au-dessus de la ligne médiane → pression haussièreval < 0→ le prix pousse en dessous de la ligne médiane → pression baissière- changements dans
valbarre par barre → augmentation ou diminution de cette pression directionnelle.
3. Comment lire les couleurs
Histogramme – pression directionnelle (valeur scanner)
Chaque barre de l'histogramme correspond à val et est colorée comme suit :
- Citron vert –
val > 0et en hausse (val > val précédent)
→ forte pression haussière, valeur scanner se renforçant vers le haut. - Vert –
val > 0mais en baisse (val ≤ val précédent)
→ toujours haussier, mais la pression faiblit. - Rouge –
val < 0et en chute (val < val précédent)
→ forte pression baissière, poussée vers le bas s'intensifiant. - Marron –
val < 0mais en hausse (val ≥ val précédent)
→ toujours baissier, mais la pression perd de la force.
Donc :
- Au-dessus de 0 → régime de pression haussière
- En dessous de 0 → régime de pression baissière
- Changement de couleur du même côté de 0 = pression accélérant ou ralentissant.
Ligne zéro – états de pression
Les points tracés à zéro montrent l'état de pression :
- Bleu – pression neutre (volatilité normale)
- Noir – Pression ACTIVÉE (compression active)
- Gris – Pression LIBÉRÉE (expansion après compression)
4. Référence des paramètres (anglais)
BB Length
Période pour la SMA et l'écart-type utilisés dans la bande de volatilité externe.
- Plus court → bande plus réactive, changements de pression plus fréquents.
- Plus long → bande plus lisse, signaux moins fréquents mais plus « macro ».
BB MultFactor
Multiplicateur pour la déviation de la bande externe (gardé comme paramètre utilisateur pour la flexibilité).
Dans ce portage, le comportement de la déviation est lié à KC MultFactor comme dans la formule originale, mais vous pouvez l'adapter si vous souhaitez un style de bande différent.
KC Length
Période pour :
- la ligne centrale du canal de volatilité,
- le lissage de la plage,
- la fenêtre haut/bas et la régression du scanner.
Définit jusqu'où Pressure Scanner regarde en arrière pour estimer la structure de volatilité et la pression directionnelle.
KC MultFactor
Contrôle la largeur du canal de volatilité et de la bande externe.
- Valeur plus grande → canal plus large, moins d'états Pression ACTIVÉE.
- Valeur plus petite → canal plus étroit, signaux de pression plus fréquents.
Use TrueRange (KC)
- true → la plage du canal utilise le True Range (capture les gaps et mouvements brusques).
- false → la plage est simplement High − Low.
Résumé
Avis clients
5 | 0 % | |
4 | 100 % | |
3 | 0 % | |
2 | 0 % | |
1 | 0 % |


![Logo de "Smart Money Concepts (SMC) [Iridio Capital]"](https://cdn.ctrader.com/image/webp/28b69fd1-ef54-4bed-9487-07e78e883be4_40934)


