Описание
Bounty Killa – индикатор, который охотится за ликвидностью стоп-лоссов раньше крупных игроков.
Bounty Killa — это индикатор для cTrader, предназначенный для трейдеров, которые любят торговать охоту за стопами / захват ликвидности: те свечи, которые вырываются выше максимумов или ниже минимумов, очищают стопы и затем разворачиваются в противоположную сторону.
Индикатор автоматически сканирует каждую свечу и отмечает:
- SHS (Stop Hunt High) – вероятная охота за стопами выше недавних максимумов → зона для поиска коротких позиций
- SHL (Stop Hunt Low) – вероятная охота за стопами ниже недавних минимумов → зона для поиска длинных позиций
Логика обнаружения основана на:
- пробое недавних максимумов/минимумов минимум на X пунктов,
- длинной тени, выходящей за этот уровень,
- маленьком теле и закрытии в противоположном направлении от пробоя.
Больше никаких догадок «возможно, это была охота за стопами»: Bounty Killer выделяет ключевые свечи прямо на вашем графике с четкими метками, цветами и легендой на графике.
Почему трейдерам это нравится:
- Показывает, где рынок мог захватить ликвидность и где разворот становится более значимым.
- Полностью настраиваемый: окно просмотра назад, минимальный пробой в пунктах, проценты тела/тени, смещение сигнала.
- Отлично сочетается с классическими уровнями поддержки/сопротивления, зонами спроса и предложения, объемом, блоками ордеров и концепциями SMC.
- Отлично подходит трейдерам, которые следуют сценариям на основе ликвидности, но хотят что-то объективное и основанное на правилах вместо чистого визуального анализа.
⚠️ Bounty Killa не является полноценной торговой системой и не открывает и не закрывает сделки.
Отмеченные свечи — это зоны с высокой информационной ценностью, которые должны интегрироваться с вашей собственной стратегией, анализом тренда и управлением рисками.
Bounty Killa – Быстрое руководство пользователя (EN)
1. Рекомендуемые рынки и таймфреймы
- Таймфреймы: H1, H4, D1
(Нижние таймфреймы, такие как M1–M5, дают много шума, используйте их в основном для изучения.) - Символы: индексы, FX, криптовалюты, акции, товары – везде, где можно подключить индикатор cTrader.
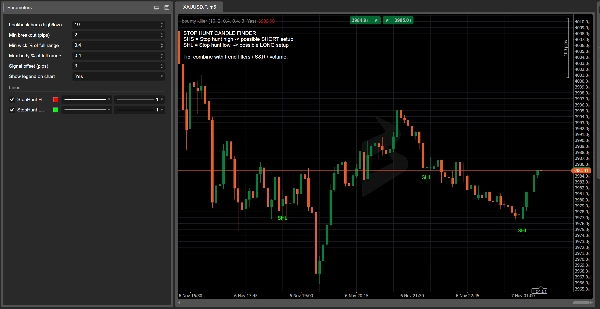
2. Как читать сигналы
- SHS – Stop Hunt High (красная метка над свечой)
-
- Цена вырывается выше недавних максимумов, образует длинную верхнюю тень и закрывается медвежьей.
- Идея: потенциальная короткая позиция после ложного пробоя и захвата ликвидности выше максимумов.
- SHL – Stop Hunt Low (зеленая метка под свечой)
-
- Цена вырывается ниже недавних минимумов, образует длинную нижнюю тень и закрывается бычьей.
- Идея: потенциальная длинная позиция после ложного пробоя вниз и захвата ликвидности ниже минимумов.
Bounty Killer не говорит «покупайте/продавайте сейчас».
Он выделяет зоны ликвидности, где разворот имеет больше смысла.
3. Рекомендуемые базовые настройки
В параметрах индикатора:
- Количество баров для просмотра назад (high/low):
10–20
→ сколько баров смотреть назад для определения недавних максимумов/минимумов. - Минимальный пробой (пункты):
5–15пунктов
→ минимальное расстояние за пределами максимума/минимума, чтобы считать это охотой за стопами. - Минимальный процент тени от полного диапазона:
0.60–0.70
→ как минимум 60–70% свечи должно быть тенью в направлении охоты за стопами. - Максимальный процент тела от полного диапазона:
0.25–0.35
→ маленькое тело по сравнению с общим диапазоном свечи. - Смещение сигнала (пункты):
3–5
→ только визуально, сдвигает метку SHS/SHL немного от свечи.
4. Простой пример стратегии
Фильтр тренда (EMA 200):
- Добавьте EMA 200 на ваш график.
- Только шорты:
-
- Цена ниже EMA 200
- Вы получаете сигнал SHS (охота за стопами на максимуме).
- Только лонги:
-
- Цена выше EMA 200
- Вы получаете сигнал SHL (охота за стопами на минимуме).
Идея входа:
- Дождитесь закрытия свечи охоты за стопами.
- Входите на следующей свече только если цена подтверждает:
-
- Для SHS: следующая свеча пробивает минимум свечи SHS → рассматривайте короткую позицию.
- Для SHL: следующая свеча пробивает максимум свечи SHL → рассматривайте длинную позицию.
Стоп-лосс:
- Для SHS (шорт) → SL чуть выше максимума свечи SHS.
- Для SHL (лонг) → SL чуть ниже минимума свечи SHL.
Тейк-профит:
- Цельтесь как минимум в 1:1.5 или 1:2 R/R, или
- Используйте ближайшие локальные максимумы/минимумы, уровни поддержки/сопротивления или зоны спроса/предложения в качестве целей.
5. Меры предосторожности и быстрый чек-лист
Перед использованием сигнала Bounty Killer задайте себе вопросы:
- Тренд?
Соответствует ли сигнал общему тренду (EMA 200 / структура рынка)? - Уровень?
Происходит ли охота за стопами на значимом уровне (предыдущий максимум/минимум, уровни поддержки/сопротивления, максимум/минимум сессии и т.д.)? - Контекст?
Есть ли новости, открытие/закрытие сессии, всплески волатильности? - Риск?
Подходит ли размер стопа для вашего управления капиталом (максимальный % на сделку)?
Если 3–4 из этих пунктов совпадают, SHS/SHL от Bounty Killa — это не просто «красивая свеча», а зона высокой ценности, вокруг которой можно строить торговую идею.
Сводка
The detection criteria include a breakout beyond recent highs/lows by a configurable number of pips, a long wick extending beyond that level, a small candle body, and a close opposite to the breakout direction. Signals are displayed directly on the chart with clear labels and colors, supported by an on-chart legend.
Recommended for use on hourly to daily timeframes (H1, H4, D1) across various markets including forex, indices, cryptocurrencies, stocks, and commodities, Bounty Killa is fully customizable with parameters such as lookback period, minimum breakout size, wick and body proportions, and signal label offset.
The indicator highlights high-value liquidity zones to support trading decisions but does not execute trades. It is intended to be combined with other analysis tools like support/resistance, volume, order blocks, and trend filters (e.g., 200 EMA) for developing objective, rule-based liquidity-based trading setups.
Отзывы покупателей
5 | 50 % | |
4 | 50 % | |
3 | 0 % | |
2 | 0 % | |
1 | 0 % |


