
الوصف
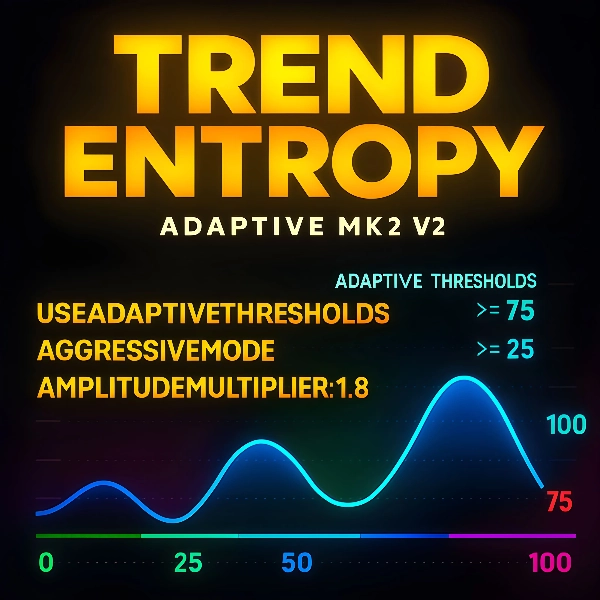
تردد الإنتروبيا – مؤشر cTrader مجاني
الإنتروبيا هي المقياس العلمي للفوضى أو عدم اليقين في نظام ما. في الفيزياء، تُظهر كيف تنتشر الطاقة ولماذا تتحرك الأنظمة نحو الفوضى. في نظرية المعلومات، تقيس عدم القدرة على التنبؤ في البيانات. الإنتروبيا المنخفضة تعني النظام والقابلية للتنبؤ، بينما تعكس الإنتروبيا العالية العشوائية والتعقيد وتقليل وضوح النتائج.
اكتشف قوة النظام داخل الفوضى. تردد الإنتروبيا هو مؤشر تقني متطور مصمم لقياس التنظيم مقابل العشوائية في تحركات الأسعار. على عكس المذبذبات التقليدية التي تتتبع فقط الزخم أو التقلب، يطبق تردد الإنتروبيا حسابات إنتروبيا متقدمة ليكشف ما إذا كان السوق يتجه بطريقة منظمة أو ينزلق إلى سلوك نطاقي فوضوي.
هذه الأداة المجانية موجهة للمتداولين الذين يرغبون في فهم أعمق للديناميكيات الخفية لتحركات الأسعار. من خلال دمج الإنتروبيا الإحصائية مع تمليس على طريقة RSI وحدود تكيفية، يحول تردد الإنتروبيا التقلب الخام إلى مقياس واضح ومُطَبَّع من 0% إلى 100%. النتيجة هي خط واحد أنيق يخبرك ما إذا كان السوق في اتجاه قوي، أو تجميع محايد، أو نطاق متقلب.
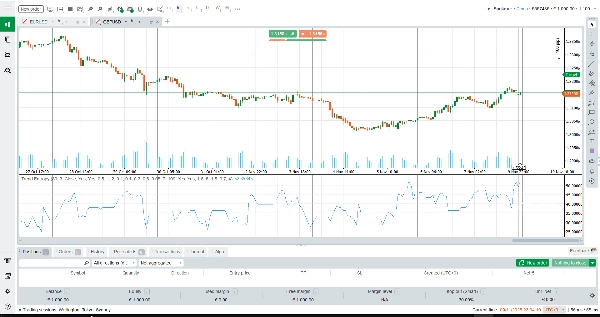
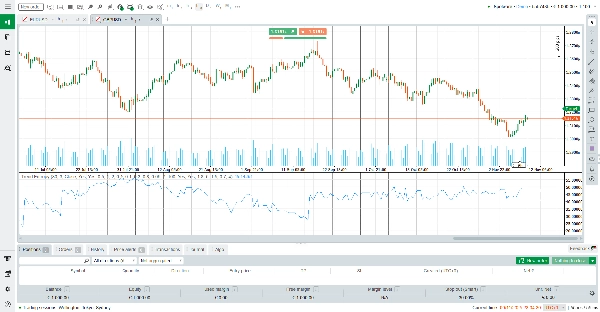
كيفية قراءة تردد الإنتروبيا
القيم المنخفضة (0–33%): السوق منظم. إذا كان العائد المتوسط إيجابيًا، فهذا يشير إلى اتجاه صاعد محتمل. إذا كان سلبيًا، فهذا يشير إلى اتجاه هابط محتمل.
القيم المتوسطة (34–66%): منطقة محايدة. قد يكون السوق في حالة تجميع، مع ميل طفيف نحو الصعود أو الهبوط اعتمادًا على العائد المتوسط.
القيم العالية (67–100%): الفوضى تسود. حركة السعر في نطاق، غير متوقعة، وأقل موثوقية لاستراتيجيات متابعة الاتجاه.
خطوط مرجعية أفقية عند 25%، 50%، و75% تجعل التفسير بسيطًا. يمكن للمتداولين رؤية ما إذا كانت الإنتروبيا تضغط نحو النظام أو تتوسع نحو الفوضى على الفور.
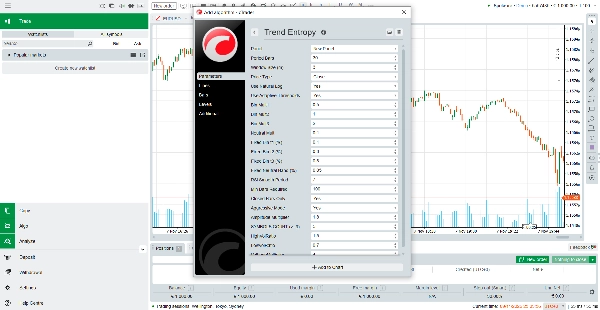
كيف يعمل المؤشر
يحسب تردد الإنتروبيا العوائد خلال فترة مختارة ويحولها إلى حالات رمزية. تُحلل هذه الحالات في نوافذ متداخلة لبناء توزيع تكراري لأنماط السعر. باستخدام رياضيات الإنتروبيا، يقيس المؤشر درجة الفوضى في هذه التسلسلات.
لجعل الناتج عمليًا، يتم تطبيع الإنتروبيا الخام إلى مقياس نسبة مئوية ثم يتم تمليسها باستخدام طريقة التمليس على طريقة وايلدر. تضمن الحدود التكيفية تعديل المؤشر وفقًا للتقلب الحالي، بينما يعزز الوضع العدواني الإشارات للمتداولين الذين يفضلون استجابات أكثر حدة. وأخيرًا، تُطبق نسب التقلب لتحسين القراءة، مما يدفع القيم إلى الأعلى في الظروف الفوضوية وإلى الأسفل في الظروف المستقرة.
النتيجة النهائية هي خط واحد مملس يلتقط جوهر هيكل السوق: سواء كان السعر يتجه بنظام أو ينزلق إلى العشوائية.
الميزات الرئيسية
تحليل قائم على الإنتروبيا – يتجاوز الزخم لقياس التنظيم الحقيقي لتحركات السعر.
حدود تكيفية – تضبط تلقائيًا مع التقلب، مما يحافظ على ملاءمة الإشارات في جميع ظروف السوق.
تمليس على طريقة RSI – يوفر خطًا نظيفًا ومستقرًا يتجنب التقلبات الصاخبة.
دمج التقلب – يعزز الدقة من خلال مقارنة نسب التقلب قصيرة وطويلة الأجل.
تصميم بصري واضح – مستويات مرجعية أفقية وخط واحد باللون DodgerBlue تجعل التفسير سهلاً.
لماذا تختار تردد الإنتروبيا؟
تردد الإنتروبيا ليس مجرد مذبذب آخر. إنه أداة هجينة تجمع بين الصرامة الإحصائية والتصور الصديق للمتداول. سواء كنت متابعًا للاتجاه تبحث عن تأكيد، أو متداول نطاق يسعى لتجنب الأسواق الفوضوية، يمنحك هذا المؤشر الوضوح الذي تحتاجه.
الملخص
The indicator outputs a single smoothed line on a normalized scale from 0% to 100%, where low values (0–33%) indicate organized trending markets, mid values (34–66%) suggest neutral or consolidating conditions, and high values (67–100%) reflect chaotic, ranging markets. Horizontal reference lines at 25%, 50%, and 75% aid interpretation.
Trend Entropy pro incorporates RSI-style smoothing, adaptive thresholds that adjust to current volatility, and volatility ratio integration to enhance signal accuracy. It is designed to provide traders with deeper insight into market dynamics beyond traditional momentum or volatility indicators, supporting analysis across various markets including Forex, cryptocurrencies, commodities, indices, and stocks.
This indicator is suitable for traders seeking to identify trending versus ranging conditions and improve decision-making in trend-following or range-trading strategies.


