الوصف
نظرة عامة
يقيس مؤشر توازن القوى قوة المشترين مقابل البائعين من خلال تقييم قدرة كل جانب على دفع الأسعار إلى مستويات قصوى.
تم تقديمه بواسطة إيغور ليفشين في عدد أغسطس 2001 من التحليل الفني للأسهم والسلع، يحسب BOP نسبة حركة السعر ضمن نطاق كل شريط ليكشف عن ديناميكيات القوة الداخلية بغض النظر عن اتجاه السعر.
المفهوم
يقيس توازن القوى مكان إغلاق السعر ضمن نطاق كل شريط ليكشف المعركة الداخلية بين المشترين والبائعين.
المبدأ الأساسي بسيط: المشترون يدفعون الأسعار نحو الأعلى، والبائعون يدفعون نحو الأدنى. حيث يغلق السعر في النهاية ضمن هذا النطاق يكشف من سيطر على فترة التداول.
يتم تنعيم القيم الخام باستخدام المتوسط المتحرك لتقليل الضوضاء وكشف الضغط الاتجاهي المستمر، مما يحول القراءات المتقلبة من شريط إلى آخر إلى مقياس زخم نظيف يتتبع تحولات السيطرة على السوق.
تطبيق هيكل السوق
يوفر BOP تحليلاً للقوة الداخلية يمكنه تأكيد أو نفي هيكل السعر:
تحديد مرحلة الاتجاه
- اتجاه صعودي قوي: BOP فوق الصفر باستمرار مع قيعان أعلى
- اتجاه هبوطي قوي: BOP تحت الصفر باستمرار مع قمم أدنى
- توحيد: BOP يتأرجح حول خط الصفر
- مناطق الانتقال: BOP يكسر الهيكل السابق (قمة أعلى/قاع أدنى)
تلاقي الدعم/المقاومة
- عودة BOP إلى الصفر غالبًا ما تتزامن مع اختبار السعر لمستويات رئيسية
- قراءات BOP القصوى (+0.8 إلى +1.0 أو -0.8 إلى -1.0) قد تشير إلى الإرهاق بالقرب من الهيكل
- التباعد عند مستويات الهيكل يشير إلى رفض محتمل أو اختراق
التوزيع/التراكم
- ارتفاع الأسعار مع انخفاض BOP: مرحلة توزيع محتملة
- انخفاض الأسعار مع ارتفاع BOP: مرحلة تراكم محتملة
- هذه التباعدات أكثر أهمية بالقرب من مستويات الهيكل الرئيسية
استراتيجية متعددة الأطر الزمنية
استخدام BOP عبر الأطر الزمنية يوفر السياق والدقة:
1. الإطار الزمني الأعلى (HTF) - التحيز الاتجاهي:
- BOP اليومي/4 ساعات فوق الصفر → البحث عن فرص شراء في الأطر الزمنية الأدنى
- BOP اليومي/4 ساعات تحت الصفر → البحث عن فرص بيع في الأطر الزمنية الأدنى
- عبور BOP في HTF للصفر → تحول رئيسي في الاتجاه، انتظر التأكيد
2. الإطار الزمني الأدنى (LTF) - توقيت الدخول:
- توافق BOP في 1 ساعة/15 دقيقة مع HTF → إعدادات عالية الاحتمالية
- تقاطع BOP/الإشارة في LTF باتجاه HTF → محفز الدخول
- توسع المدرج التكراري في LTF يؤكد الزخم
3. توافق الأطر الزمنية:
- اتفاق جميع الأطر الزمنية → أقوى الصفقات بثقة
- تباعد HTF وLTF → انتظر الحل أو تجنب الصفقة
- انعكاس LTF ضد HTF → احتمالية تقليم الاتجاه المعاكس فقط
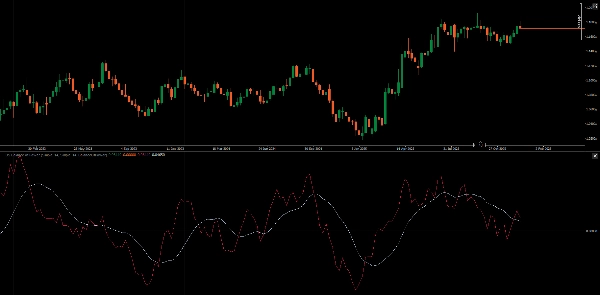
خط الإشارة والمدرج التكراري
خط الإشارة (MA لـ BOP):
- تقاطع BOP/الإشارة يوفر إشارات دخول/خروج مفلترة
- ميل خط الإشارة يشير إلى استمرار الزخم
- المسافة بين BOP وخط الإشارة تظهر امتداد الحركة
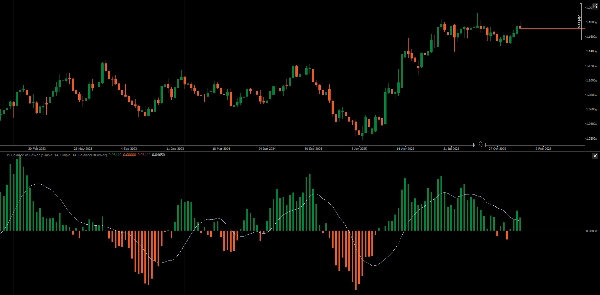
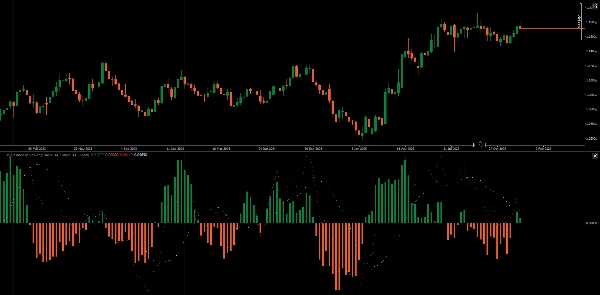
أنماط المدرج التكراري:
- وضع القيمة: يظهر قطبية BOP نسبة إلى الصفر (هيمنة المشتري/البائع)
- وضع الإشارة: يظهر الفرق بين BOP والإشارة، كاشفًا تحولات الزخم قبل التقاطعات
في وضع الإشارة، تحدث تقاطعات خط الصفر للمدرج التكراري قبل تقاطعات خط BOP/الإشارة، مما يوفر تحذيرًا مبكرًا لتغير الزخم.
الميزات
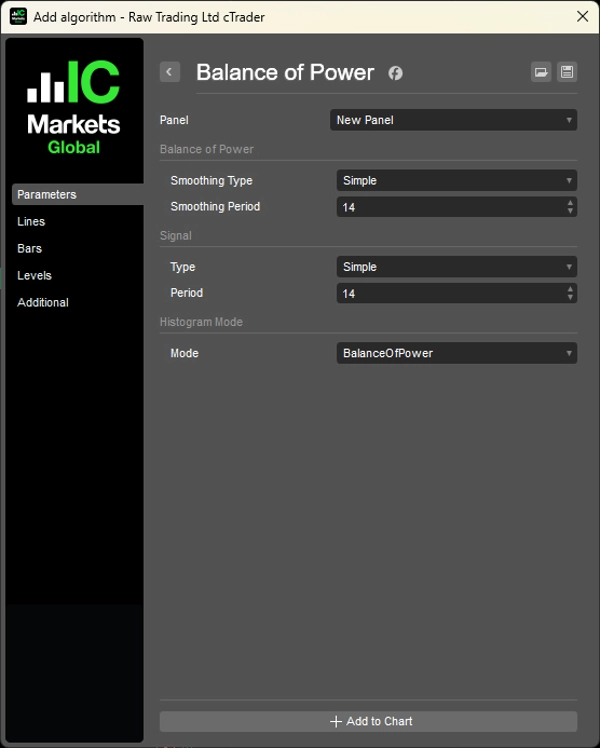
- فترة التنعيم: فترة MA قابلة للتعديل لـ BOP (الافتراضي 14)
- نوع التنعيم: اختيار أنواع MA (SMA، EMA، إلخ)
- فترة الإشارة: فترة MA قابلة للتعديل لخط الإشارة (الافتراضي 14)
- نوع الإشارة: اختيار أنواع MA لخط الإشارة
- وضع المدرج التكراري: التبديل بين عرض القيمة وفارق الإشارة
مثال عملي
- HTF (يومي): BOP فوق الصفر ويرتفع → تحيز صعودي
- السعر يتراجع إلى الدعم
- LTF (1 ساعة): BOP يتقاطع فوق الإشارة → محفز الدخول
- المدرج التكراري (وضع الإشارة) يتوسع → يؤكد تسارع الزخم
- الخروج عندما ينكمش المدرج التكراري في LTF أو يتقاطع BOP تحت الإشارة
__________________________________________________________________________________________
مزيد من المؤشرات المجانية
استكشف مجموعة واسعة من أدوات تحليل السوق — من الهيكل والحجم إلى الانحدار والتقلب والأطر الزمنية المخصصة.
رمز المصدر متاح على GitHub المستودع.
جميعها مجانية للاستخدام. ولكن إذا رغبت في دعم القهوة، يمكنك توجيهها هنا.
الدعم/المقاومة
الحجم
- محلل نشاط الحجم
- محلل كفاءة الحجم
- تحليلات ملف الحجم
- ملف الحجم - محدث
- تحليل انتشار الحجم
- VWAP (متوسط السعر المرجح بالحجم)
المتوسطات المتحركة
- قناة SSL
- المتوسط المتحرك المثبت
- المتوسط المتحرك بمقياس الانحراف
- منشط جان العالي والمنخفض
- خط الاتجاه اللحظي
- متوسط كاوفمان التكيفي مع رؤية الاتجاه
- قناة المتوسط المتحرك
- مجموعة المتوسطات المتحركة
- متوسط قناة الاتجاه المتحرك
الأدوات المساعدة/المخصصة
مبني على الانحدار
التقلب
المذبذبات
__________________________________________________________________________________________
إخلاء المسؤولية
التداول ينطوي على مخاطر. هذا المؤشر مخصص للتحليل الفني فقط — دائماً طبق إدارة المخاطر المناسبة وتداول بمسؤولية.
التعليقات والتحسينات
إذا كانت لديك اقتراحات أو طلبات ميزات أو أفكار للتحسين، يرجى ترك تعليق في علامة التبويب النقاش. تساعد ملاحظاتك في تحسين المؤشر للجميع.
الملخص
Key functionalities include identifying trend phases—strong uptrends, downtrends, consolidation, and transition zones—by observing BOP behavior relative to the zero line. It also aids in detecting support and resistance confluence, with extreme BOP readings indicating potential exhaustion near key levels and divergences signaling possible rejections or breakthroughs. The indicator helps identify distribution and accumulation phases through price and BOP divergences.
BOP supports multi-timeframe analysis: higher timeframes provide directional bias, while lower timeframes offer entry timing signals via BOP and signal line crossovers and histogram momentum confirmation. The signal line is a moving average of BOP, with crossovers serving as filtered entry/exit triggers. The histogram can display either BOP polarity or the difference between BOP and its signal line, offering early momentum shift warnings.
Adjustable parameters include smoothing periods and types for both BOP and signal lines, and histogram display modes. The indicator is applicable across Forex, indices, commodities, cryptocurrencies, and stocks markets.