Description
📌 Ce que fait l'indicateur
MarketStructureOscSignals est un outil de signal purement basé sur l'action des prix.
Il :
- Détecte les sommets et creux de balancement en utilisant un retour en arrière à gauche/droite.
- Suit si ces balancements forment :
-
- Des sommets plus hauts + des creux plus hauts → structure haussière
- Des sommets plus bas + des creux plus bas → structure baissière
- Lorsque la structure change :
-
- De baissière → haussière → il trace un signal d'ACHAT
- De haussière → baissière → il trace un signal de VENTE
Ainsi, chaque signal représente un véritable changement dans la structure du marché, pas seulement un croisement de moyenne mobile.
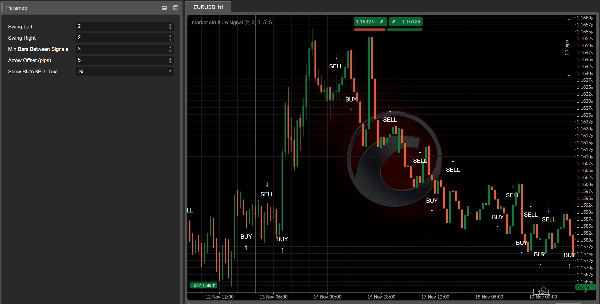
⚙️ Entrées & Comment les configurer
1. Swing Left / Swing Right
Ces paramètres contrôlent la “rigueur” d’un sommet/creux de balancement.
- Swing Left (par défaut 2)
Nombre de barres à gauche du balancement qui doivent avoir des sommets plus bas (pour un sommet) ou des creux plus hauts (pour un creux). - Swing Right (par défaut 2)
Nombre de barres à droite qui doivent aussi confirmer le balancement.
Comment l’utiliser :
- Petites valeurs (1–2) :
-
- Plus de balancements, plus de signaux
- Fonctionne bien sur les unités de temps supérieures (H1, H4, D1)
- Valeurs plus grandes (3–4+) :
-
- Seulement les retournements structurels majeurs
- Moins de signaux mais plus forts
- Bon sur les unités de temps inférieures pour éviter le bruit
2. Min Bars Between Signals
Nombre minimum de barres qui doivent s’écouler entre deux signaux.
- Évite le regroupement des flèches à chaque petit retracement.
- Exemple :
-
- Réglé sur
3→ au moins 3 barres entre un signal et le suivant. - Sur des graphiques très rapides (M1–M5), vous pouvez vouloir
5–10. - Sur H1 ou plus,
2–3est généralement suffisant.
- Réglé sur
3. Arrow Offset (pips)
Distance à laquelle la flèche et le label sont placés par rapport à la bougie (en pips).
- Pour le Forex :
-
5–10pips ont généralement une bonne apparence.
- Pour les indices (US500, US100, etc.) :
-
- Utilisez un décalage plus grand (par ex. 20–50 “pips” selon la taille du pip du courtier).
Si les flèches chevauchent les bougies, augmentez cette valeur.
Si elles sont trop éloignées, diminuez-la.
4. Afficher le texte ACHAT/VENTE
true→ affiche à la fois une flèche (↑/↓) et le texte “ACHAT” ou “VENTE”.false→ uniquement les flèches.
Si le graphique semble encombré, vous pouvez cacher le texte et ne garder que les flèches.
🔍 Comment les signaux sont générés (logique)
En interne, l’indicateur :
- Garde la trace des deux derniers sommets de balancement et des deux derniers creux de balancement :
-
_prevHigh,_lastHigh_prevLow,_lastLow
- À partir de ceux-ci, il vérifie :
-
- Les sommets et creux montent tous les deux ?
-
- → Tendance haussière (
StructureTrendSignal.Bullish)
- → Tendance haussière (
- Les sommets et creux baissent tous les deux ?
-
- → Tendance baissière (
StructureTrendSignal.Bearish)
- → Tendance baissière (
- S’ils ne sont pas alignés, la tendance précédente est conservée.
- Chaque fois que la tendance structurelle change :
-
Baissière → Haussière→ signal d'ACHATHaussière → Baissière→ signal de VENTE
- Il s’assure également :
-
- Que la tendance n’était pas
Inconnue(donc pas au tout début). - Qu’un nombre suffisant de barres s’est écoulé depuis le dernier signal (
MinBarsBetweenSignals).
- Que la tendance n’était pas
Cela signifie que chaque flèche marque un véritable changement structurel, pas un bruit aléatoire.
📈 Comment lire les signaux ACHAT/VENTE sur le graphique
✅ Signal ACHAT
Ce que vous voyez :
- Une flèche vers le haut
↑sous la bougie - Éventuellement le texte “ACHAT” près de la flèche
Ce que cela signifie :
- La structure est passée de baissière à haussière.
- Les derniers sommets et creux de balancement montent tous les deux.
- Le marché est probablement en train de passer à une nouvelle tendance haussière ou de reprendre une structure haussière.
Comment l’utiliser :
- Cherchez des entrées longues :
-
- Sur la bougie du signal ou sur les quelques bougies suivantes.
- De préférence après un petit retracement vers un niveau de support (creux de balancement précédent, zone de demande, VWAP, VA low, etc.).
- Utilisez des outils comme Kalman Trend / EMA / Volume Profile pour filtrer :
-
- N’acceptez les ACHATS que lorsque l’unité de temps supérieure ou Kalman est également haussière.
✅ Signal VENTE
Ce que vous voyez :
- Une flèche vers le bas
↓au-dessus de la bougie - Éventuellement le texte “VENTE”
Ce que cela signifie :
- La structure est passée de haussière à baissière.
- Les sommets et creux de balancement baissent tous les deux.
- Le marché est probablement en train d’entrer dans une tendance baissière ou de reprendre une structure baissière.
Comment l’utiliser :
- Cherchez des entrées courtes :
-
- Sur la bougie du signal ou sur les bougies suivantes près d’une résistance.
- Idéal après un retest d’un support cassé (devenu résistance), VAH, zone d’offre, etc.
🎯 Utilisations pratiques en trading
1. Comme outil d’entrée autonome
Règles simples :
- Configuration d’achat
-
- Attendez une flèche d’ACHAT.
- Passez un ordre long à/près de la bougie du signal.
- Stop loss sous le creux de balancement récent.
- Objectif au sommet de balancement précédent ou une résistance clé.
- Configuration de vente
-
- Attendez une flèche de VENTE.
- Passez un ordre court à/près de la bougie du signal.
- Stop loss au-dessus du sommet de balancement récent.
- Objectif au creux de balancement précédent ou un support clé.
C’est l’utilisation la plus basique et elle fonctionne mieux sur H1, H4 et D1, où la structure est plus claire.
2. Comme outil de confirmation avec vos autres indicateurs
C’est là que cela devient puissant.
🔹 Avec Kalman Filter Trend
- N’acceptez les signaux d’ACHAT que lorsque :
-
- La tendance Kalman est orientée à la hausse et le prix est au-dessus ou à la ligne Kalman.
- N’acceptez les signaux de VENTE que lorsque :
-
- La tendance Kalman est orientée à la baisse et le prix est en dessous ou à la ligne Kalman.
Effet :
Kalman vous donne une tendance lissée, MarketStructureOscSignals vous donne des changements structurels précis. Ensemble, ils filtrent beaucoup de mauvaises transactions.
🔹 Avec Volume Profile / Support & Resistance
- ACHAT fort :
-
- La flèche d’ACHAT apparaît près de VA Low, du creux de balancement précédent, ou d’un balayage de liquidité, avec rejet.
- VENTE forte :
-
- La flèche de VENTE apparaît près de VA High, du sommet de balancement précédent, ou d’un balayage de liquidité en haut.
Ici, le signal n’est pas seulement un motif technique mais est aussi ancré dans les zones de liquidité et de flux d’ordres.
3. Pour scaler en entrée / sortie
Vous pouvez aussi utiliser les nouveaux signaux comme :
- Points d’ajout de position
Ajoutez à une position lorsqu’un nouveau signal apparaît dans la même direction que votre trade existant et que l’unité de temps supérieure est alignée. - Sortie anticipée / sortie partielle
Si vous êtes long et qu’un signal de VENTE apparaît contre votre position (surtout près d’une structure clé), vous pouvez : -
- Fermer une partie de la position
- Ou resserrer les stops
🧪 Paramètres de départ recommandés
Pour Forex H1 / H4 :
Swing Left = 2Swing Right = 2Min Bars Between Signals = 3Arrow Offset = 5–10 pips
Pour Indices M15 / H1 :
Swing Left = 2–3Swing Right = 2–3Min Bars Between Signals = 5Arrow Offsetadapté au symbole (par ex. 20–50 “pips” selon le courtier)
Pour Crypto H1 / H4 :
- Balancements légèrement plus importants pour filtrer le bruit :
-
Swing Left = 3Swing Right = 3Min Bars Between Signals = 4–6
Faites toujours des backtests avec votre instrument et unité de temps préférés pour affiner Swing et MinBarsBetweenSignals.
Résumé
Avis clients
5 | 100 % | |
4 | 0 % | |
3 | 0 % | |
2 | 0 % | |
1 | 0 % |


