Description
Analyse professionnelle du volume basée sur la plage avec calcul intelligent du delta des chandeliers
Débloquez la puissance d'une analyse précise du volume avec RANGE DELTA CANDLE VOLUME PROFILE, l'indicateur ultime de profil de volume basé sur la plage pour cTrader. Conçu pour les traders qui ont besoin d'une analyse flexible et précise du volume sur des plages temporelles personnalisées, cet indicateur offre des insights de qualité institutionnelle grâce à un calcul intelligent du delta basé sur les chandeliers.
🎯 CARACTÉRISTIQUES CLÉS
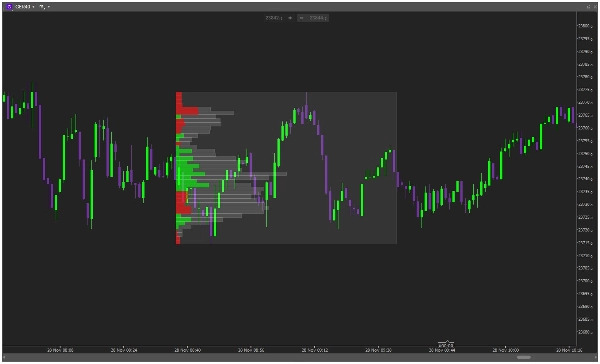
🏓 ANCRAGE FLEXIBLE DE LA PLAGE
- Utilisez des lignes de tendance pour définir TOUTE plage temporelle personnalisée
- Génération dynamique du profil entre vos points choisis
- Mises à jour en temps réel au fur et à mesure de l'évolution du marché
- Options d'ancrage à gauche ou à droite
📊 ANALYSE INTELLIGENTE DU DELTA BASÉE SUR LES CHANDELIERS
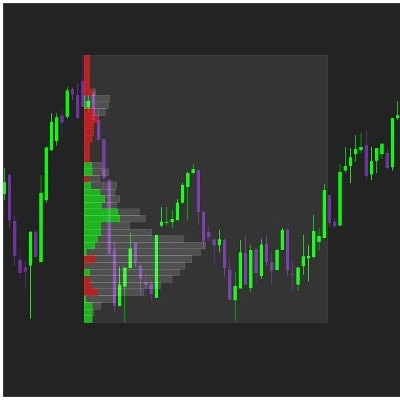
- Calcul avancé du delta basé sur la direction du chandelier
- Chandeliers verts = Volume d'achat | Chandeliers rouges = Volume de vente
- Visualisation claire, en couleur unique par niveau de prix
- Identification instantanée des zones d'accumulation/distribution
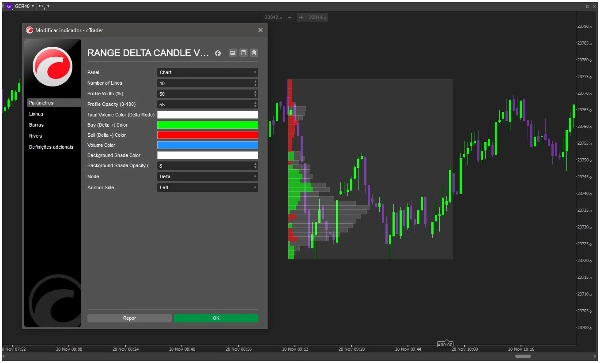
🎨 AFFICHAGE ENTIÈREMENT PERSONNALISABLE
- Nombre réglable de bacs/lignes (5-100)
- Largeur du profil personnalisable (5-300% de la plage)
- Contrôle complet des couleurs pour volume achat/vente/total
- Paramètres de transparence et d'opacité
⚡ MODES D'AFFICHAGE DOUBLES
- Mode Delta : Visualisez la pression nette d'achat/vente
- Mode Volume : Affichage traditionnel du profil de volume
- Choisissez entre ancrage à gauche ou à droite
🚀 POURQUOI LES TRADERS LE CHOISISSENT
"La flexibilité d'analyser n'importe quelle plage personnalisée change la donne. Parfait pour l'analyse des sessions et les mouvements clés du marché." - Trader professionnel journalier
"Enfin, un profil de volume basé sur la plage qui a vraiment du sens. Le delta basé sur les chandeliers est incroyablement précis." - Trader swing
📈 IDÉAL POUR
- Analyse de session - Analyse des sessions de trading spécifiques (Londres, NY, Asie)
- Trading basé sur les événements - Étude du volume autour des événements d'actualité et des données économiques
- Analyse technique - Confirmation des supports/résistances avec validation du volume
- Structure du marché - Identification des zones de valeur et des écarts de volume
🛠 SIMPLE À UTILISER
- Tracez une ligne de tendance entre vos points de départ et d'arrivée
- Observez le profil de volume se générer automatiquement
- Analysez la distribution du delta sur votre plage personnalisée
- Tradez avec des niveaux et des insights confirmés par le volume
🔧 SPÉCIFICATIONS TECHNIQUES
- Calcul et mises à jour en temps réel
- Faible consommation de ressources
- Compatible avec toutes les unités de temps
- Fonctionne avec tous les instruments de trading
📋 OPTIONS DE PERSONNALISATION
- Nombre de bacs/lignes
- Pourcentage de largeur du profil
- Contrôles d'opacité (0-100%)
- Schémas de couleurs personnalisés
- Sélection du côté d'ancrage (Gauche/Droite)
- Mode d'affichage (Delta/Volume)
🎯 AMÉLIOREZ VOTRE ANALYSE DE MARCHÉ DÈS AUJOURD'HUI !
Rejoignez les traders professionnels du monde entier qui ont transformé leur analyse de marché avec RANGE DELTA CANDLE VOLUME PROFILE. Cessez d'utiliser des outils rigides à plage fixe et commencez à analyser le volume exactement là où vous en avez besoin.
⭐ "La capacité d'analyser des plages personnalisées avec un calcul delta précis a complètement changé ma façon d'aborder la structure du marché. Outil essentiel !"
Ajoutez RANGE DELTA CANDLE VOLUME PROFILE à votre plateforme cTrader dès aujourd'hui et maîtrisez l'analyse du volume dans toutes les conditions de marché !
🆚 POURQUOI CHOISIR CECI PLUTÔT QUE D'AUTRES PROFILS DE VOLUME ?
- ✅ Véritable flexibilité - Analysez TOUTE plage temporelle personnalisée
- ✅ Delta précis - Calcul basé sur les chandeliers pour des résultats fiables
- ✅ Visualisation professionnelle - Affichage clair de qualité institutionnelle
- ✅ Personnalisation réelle - Contrôle complet de tous les aspects visuels
- ✅ Méthodologie éprouvée - Basée sur des principes de trading professionnels
Transformez votre analyse graphique avec la puissance du profilage de volume flexible basé sur la plage !


