Description
✅ UATKit est fourni gratuitement en tant que contribution de bonne volonté à la communauté cTrader, créé par un trader professionnel qui comprend les défis quotidiens de l'analyse graphique et de l'exécution.
⚠️Veuillez vérifier périodiquement la page du produit pour les mises à jour, car cTrader ne notifie pas les utilisateurs lorsque de nouvelles versions des indicateurs sont publiées.
⭐️ Je serais également heureux de recevoir vos commentaires et retours dans les Avis Clients et Discussions sections.
1. Ce Qu'est Ce Produit
Un ensemble complet d'outils d'amélioration du flux de travail conçu pour rendre le chartisme sur cTrader plus fluide, clair et efficace.
Universal Assistant Toolkit (UATKit) est un compagnon multi-fonction pour le côté graphique de cTrader.
Il rassemble plusieurs outils pratiques - chacun conçu pour résoudre un besoin spécifique du flux de travail - en un seul indicateur unifié et léger.
Chaque fonctionnalité de UATKit est entièrement personnalisable et fonctionne indépendamment, offrant aux traders un contrôle complet pour ajuster le comportement, les visuels et les raccourcis clavier tout en activant uniquement les outils nécessaires pour une expérience graphique propre et réactive.
UATKit est fourni gratuitement en tant que contribution de bonne volonté à la communauté cTrader, créé par un trader professionnel qui comprend les défis quotidiens de l'analyse graphique et de l'exécution.
2. Pour Qui Est Ce Kit D'Outils
UATKit est conçu pour les traders qui :
- Passent beaucoup de temps à analyser les graphiques
- Préfèrent des mises en page de graphiques propres, informatives et personnalisables
- Veulent un accès plus rapide aux actions courantes via des raccourcis clavier
- Ont besoin de clarté visuelle lors des marchés rapides
- Apprécient les outils qui améliorent le flux de travail sans ajouter de bruit
Que vous fassiez du scalping, du swing trading ou que vous souhaitiez simplement un environnement graphique plus organisé, UATKit s'adapte à votre style.
3. Aperçu des Groupes de Fonctionnalités
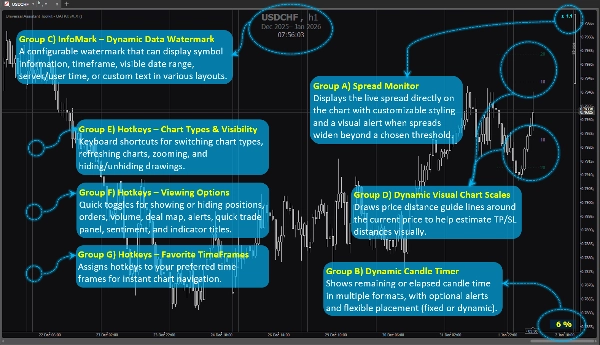
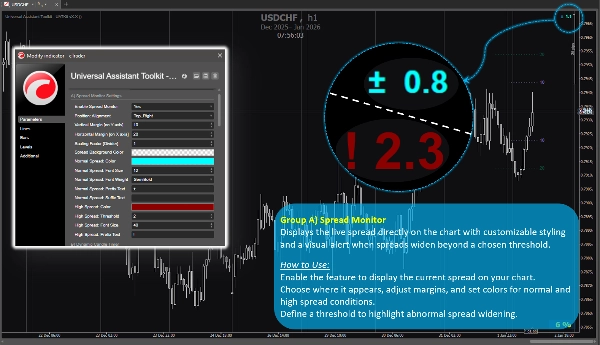
Groupe de Fonctionnalités A) 🔸 Moniteur de Spread
Affiche le spread en direct directement sur le graphique avec un style personnalisable et une alerte visuelle lorsque les spreads s'élargissent au-delà d'un seuil choisi.
Comment Utiliser :
Activez la fonctionnalité pour afficher le spread actuel sur votre graphique.
Choisissez où il apparaît, ajustez les marges et définissez les couleurs pour les conditions de spread normal et élevé.
Définissez un seuil pour mettre en évidence un élargissement anormal du spread.
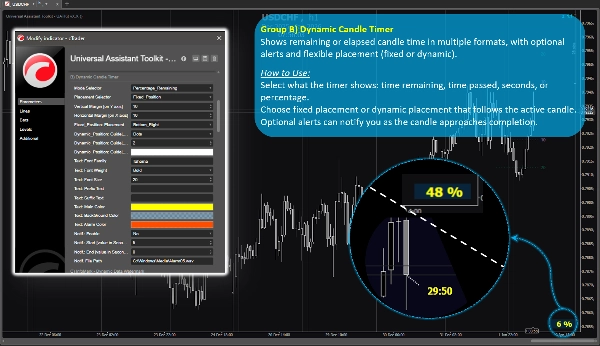
Groupe de Fonctionnalités B) 🔸 Minuteur de Bougie Dynamique
Affiche le temps restant ou écoulé de la bougie dans plusieurs formats, avec alertes optionnelles et placement flexible (fixe ou dynamique).
Comment Utiliser :
Sélectionnez ce que le minuteur affiche : temps restant, temps écoulé, secondes ou pourcentage.
Choisissez un placement fixe ou dynamique qui suit la bougie active.
Des alertes optionnelles peuvent vous notifier à l'approche de la fin de la bougie.
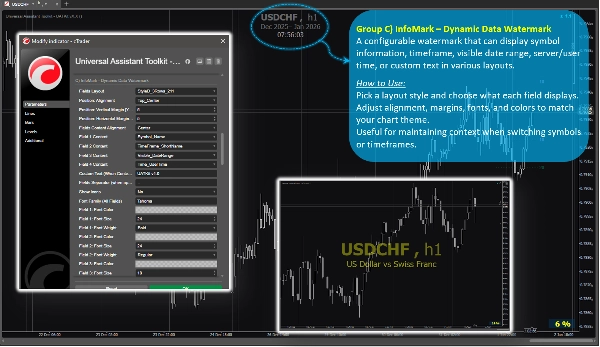
Groupe de Fonctionnalités C) 🔸 InfoMark – Filigrane de Données Dynamique
Un filigrane configurable qui peut afficher les informations du symbole, la période, la plage de dates visible, l'heure serveur/utilisateur ou un texte personnalisé dans divers agencements.
Comment Utiliser :
Choisissez un style d'agencement et ce que chaque champ affiche.
Ajustez l'alignement, les marges, les polices et les couleurs pour correspondre au thème de votre graphique.
Utile pour maintenir le contexte lors du changement de symboles ou de périodes.
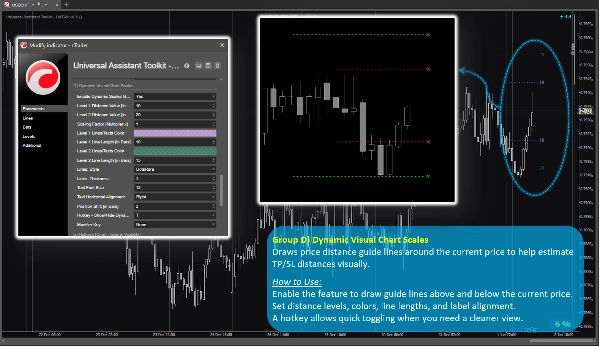
Groupe de Fonctionnalités D) 🔸 Échelles Visuelles Dynamiques du Graphique
Trace des lignes guides de distance de prix autour du prix actuel pour aider à estimer visuellement les distances TP/SL.
Comment Utiliser :
Activez la fonctionnalité pour dessiner des lignes guides au-dessus et en dessous du prix actuel.
Définissez les niveaux de distance, les couleurs, la longueur des lignes et l'alignement des étiquettes.
Un raccourci clavier permet un basculement rapide lorsque vous avez besoin d'une vue plus épurée.
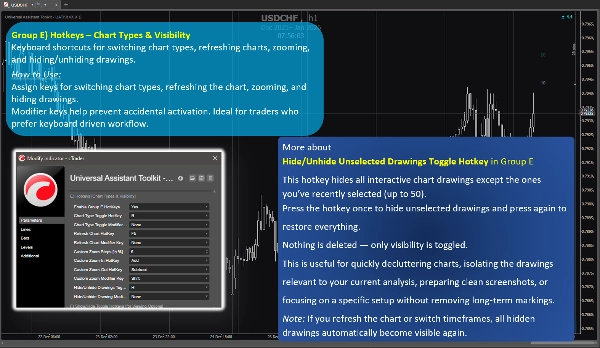
Groupe de Fonctionnalités E) 🔸 Raccourcis Clavier – Types de Graphiques & Visibilité
Raccourcis clavier pour changer les types de graphiques, rafraîchir les graphiques, zoomer et masquer/afficher les dessins.
Comment Utiliser :
Attribuez des touches pour changer les types de graphiques, rafraîchir le graphique, zoomer et masquer les dessins.
Les touches modificateurs aident à éviter les activations accidentelles. Idéal pour les traders qui préfèrent un flux de travail basé sur le clavier.
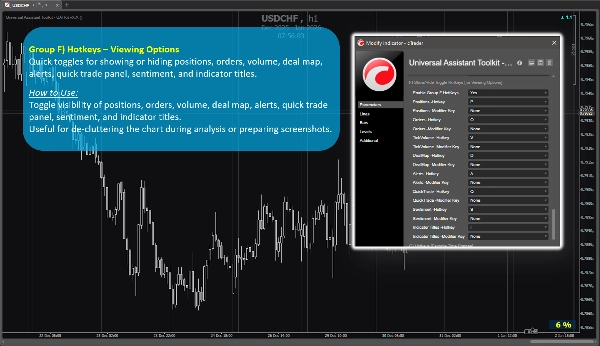
Groupe de Fonctionnalités F) 🔸 Raccourcis Clavier – Options d'Affichage
Bascule rapide pour afficher ou masquer les positions, ordres, volume, carte des transactions, alertes, panneau de trading rapide, sentiment et titres des indicateurs.
Comment Utiliser :
Activez ou désactivez la visibilité des positions, ordres, volume, carte des transactions, alertes, panneau de trading rapide, sentiment et titres des indicateurs.
Utile pour désencombrer le graphique pendant l'analyse ou préparer des captures d'écran.
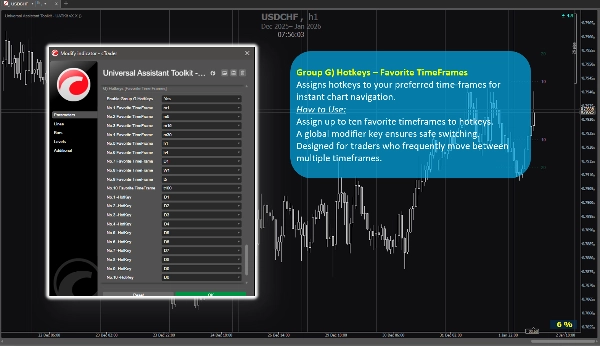
Groupe de Fonctionnalités G) 🔸 Raccourcis Clavier – Périodes Préférées
Attribue des raccourcis clavier à vos périodes préférées pour une navigation instantanée sur le graphique.
Comment Utiliser :
Attribuez jusqu'à dix périodes favorites aux raccourcis clavier.
Une touche modificateur globale assure un changement sécurisé.
Conçu pour les traders qui naviguent fréquemment entre plusieurs périodes.
4. Notes Supplémentaires Pour Les Utilisateurs
- Toutes les fonctionnalités sont optionnelles et peuvent être activées ou désactivées individuellement.
- Le kit d'outils est optimisé pour la performance et conçu pour ne pas interférer avec d'autres indicateurs.
- La plupart des paramètres incluent des info-bulles intégrées. Il suffit de survoler un réglage pour voir des conseils supplémentaires et des notes d'utilisation.
- Aucune source de données externe n'est utilisée ; toutes les informations proviennent du graphique et de la plateforme.
- Ce kit d'outils est fourni gratuitement pour soutenir la communauté cTrader et améliorer les flux de travail quotidiens du chartisme.
- Les paramètres par défaut sont judicieux, donc les utilisateurs qui n'ont pas besoin de configurations spéciales peuvent se fier aux paramètres prédéfinis sans passer de temps supplémentaire à la configuration.
- ⭐️ Les retours et suggestions sont les bienvenus pour aider à affiner les futures versions (utilisez la section discussion sur cette page).
- ⚠️Veuillez vérifier périodiquement la page du produit pour les mises à jour, car cTrader ne notifie pas les utilisateurs lorsque de nouvelles versions des indicateurs sont publiées.
Résumé
Key features include:
- **Spread Monitor:** Displays live spread on the chart with customizable visuals and alerts for spread widening.
- **Dynamic Candle Timer:** Shows remaining or elapsed candle time in various formats, with optional alerts and flexible positioning.
- **InfoMark Watermark:** Configurable watermark displaying symbol info, timeframe, date range, server/user time, or custom text.
- **Dynamic Visual Chart Scales:** Price-distance guide lines around current price to estimate take-profit/stop-loss distances visually.
- **Hotkeys for Chart Types & Visibility:** Keyboard shortcuts for switching chart types, refreshing, zooming, and toggling drawing visibility.
- **Hotkeys for Viewing Options:** Quick toggles for positions, orders, volume, deal map, alerts, quick trade panel, sentiment, and indicator titles.
- **Hotkeys for Favorite TimeFrames:** Assign up to ten favorite timeframes to hotkeys for instant navigation.
All features are optional and configurable, optimized for performance without interfering with other indicators. UATKit supports various markets including Forex, indices, commodities, crypto, and stocks. It is intended for traders who seek a clean, customizable, and efficient charting environment with enhanced workflow controls.
Avis clients
5 | 100 % | |
4 | 0 % | |
3 | 0 % | |
2 | 0 % | |
1 | 0 % |