
CE QUE ÇA FAIT
La Moyenne Mobile Déplaçable ancre une moyenne mobile à n'importe quel point de l'historique des prix — pas depuis la barre zéro, pas depuis un recul fixe, mais exactement là où vous la placez.
Les moyennes mobiles standard commencent au début des données du graphique et convergent avec le temps. Leur période est fixe. Leur référence de départ est arbitraire. Lorsque vous souhaitez mesurer comment le prix a évolué depuis un événement structurel spécifique — un début correctif, un début d'impulsion, un pivot clé — il n'y a aucun moyen d'ancrer la MM à ce moment.
Cet indicateur résout ce problème.
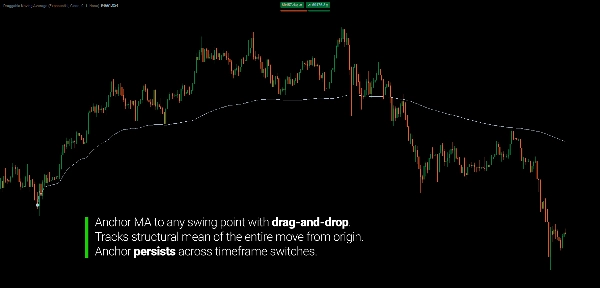
Placez l'icône d'ancrage sur n'importe quelle barre. La MM commence à cette barre et s'étend vers l'avant. Faites glisser l'icône vers une autre barre — la MM se recalcule instantanément depuis la nouvelle position. Changez d'échelle de temps — l'ancre tient, la MM se recalcule automatiquement sur le nouveau graphique.
Le résultat est une moyenne mobile qui reflète toujours comment le prix a évolué à partir d'un point structurel spécifique que vous définissez.
LE BÉNÉFICE PRINCIPAL
Approche Standard :
- Identifier le début d'un mouvement correctif ou impulsif
- Appliquer une MM à période fixe — elle commence au début du graphique, pas à votre structure
- Ajuster manuellement la période pour approcher la longueur de la structure
- Changer d'échelle de temps — la période devient sans signification avec un nombre différent de barres
- Répéter à chaque changement de structure
Approche Déplaçable :
- Placer l'ancre au début de la structure
- La MM se calcule vers l'avant à partir de cette barre exacte
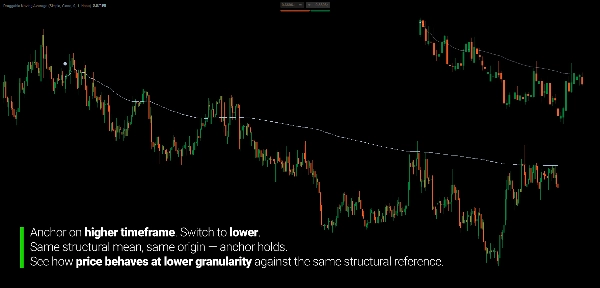
- Changer d'échelle de temps — l'ancre tient, la MM se recalcule automatiquement
- Glisser pour ajuster — tout se met à jour instantanément
La différence est structurelle. Au lieu d'approcher un point de référence par des ajustements de période, vous le définissez directement. Le point structurel est l'entrée — pas la période.
ANCRÉ À LA STRUCTURE : DÉTECTION DE LA RÉVERSION VERS LA MOYENNE ET DU RENVERSEMENT
Lorsqu'une moyenne mobile commence à partir d'un point de pivot structurel — l'origine d'une tendance, le début d'une impulsion ou le commencement d'une correction — elle cesse d'être une ligne de lissage arbitraire et commence à se comporter comme une moyenne structurelle.
Le prix s'organise autour de cette moyenne de manière prévisible :
- Pendant le mouvement, le prix oscille autour de la MM ancrée — s'éloignant lors des poussées de momentum, revenant vers la MM pendant la consolidation. La MM reflète le prix moyen de toute la structure depuis son origine, pas seulement des barres récentes.
- À l'épuisement, le prix commence à traverser la MM ancrée plutôt qu'à rebondir dessus. Une clôture en dessous d'une MM ancrée en pente ascendante — qui a suivi une impulsion depuis son origine — a une signification structurelle. La moyenne de tout le mouvement est violée.
- Après un renversement, la MM ancrée devient une résistance. Les retests de la MM par en dessous marquent des zones logiques où la moyenne structurelle précédente agit comme une offre.
Ce comportement est cohérent parce que la MM mesure la bonne chose : le prix moyen d'un mouvement structurel spécifique depuis son point de départ réel, pas depuis une période arbitraire passée.
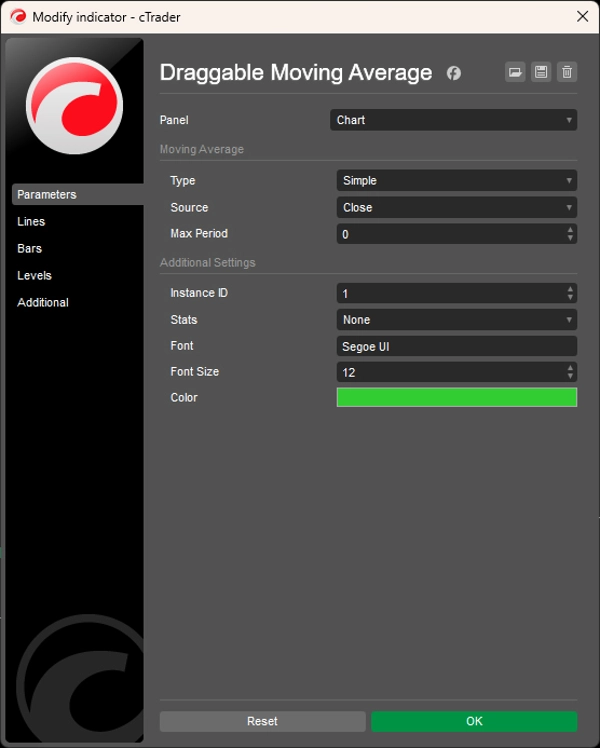
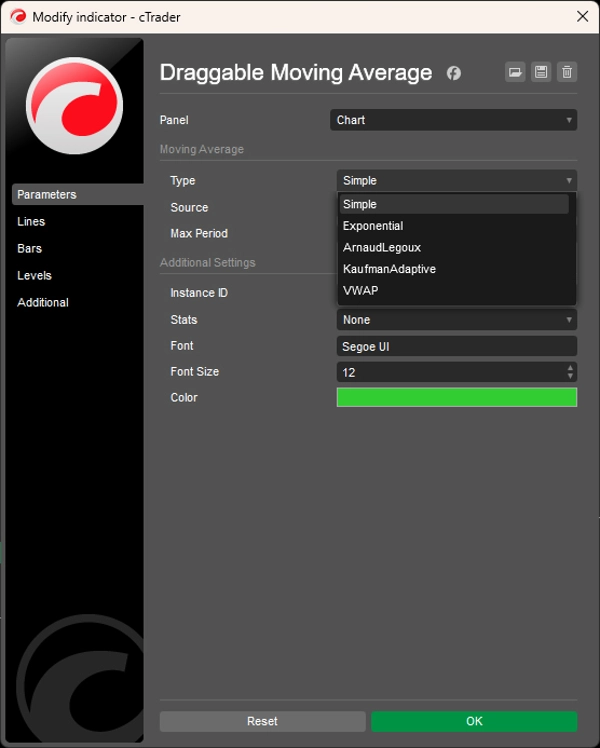
TYPES DE MM SUPPORTÉS
Cinq méthodes de calcul, sélectionnables par instance :
- Simple (SMA) — moyenne arithmétique depuis l'ancre vers l'avant ; croît à chaque barre jusqu'à atteindre la Période Max
- Exponentielle (EMA) — pondérée exponentiellement ; plus réactive à l'action récente des prix
- Arnaud Legoux (ALMA) — pondérée gaussienne ; réduit le retard sans amplifier le bruit
- Kaufman Adaptive (KAMA) — ajuste dynamiquement le lissage basé sur le ratio d'efficacité du marché ; se resserre en tendance, s'élargit en consolidation
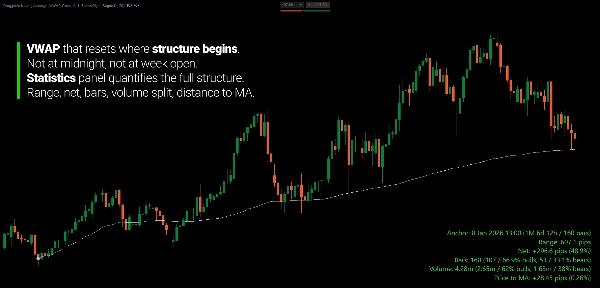
- VWAP — moyenne pondérée par le volume depuis l'ancre ; reflète où la majorité du volume a transigé depuis le point structurel
Tous les types respectent le Paramètre Période Max — limite la fenêtre de recul tout en gardant l'ancre comme référence d'origine.
PANNEAU DE STATISTIQUES
Panneau optionnel en superposition, sélectionnable dans quatre positions d'angle, affichant des métriques en temps réel de l'ancre à la barre actuelle :
- Plage en pips (plus haut plus haut au plus bas plus bas)
- Variation nette en pips et en pourcentage
- Nombre total de barres avec comptage haussier/baissier et pourcentages
- Volume total avec répartition haussière/baissière et pourcentages
- Distance actuelle du prix par rapport à la MM en pips et en pourcentage
- Durée et compteur de barres de la barre d'ancrage à la barre actuelle
Utile pour quantifier la structure exacte à laquelle vous vous êtes ancré — pas seulement la ligne de MM, mais le profil statistique complet du mouvement de prix de l'origine à maintenant.
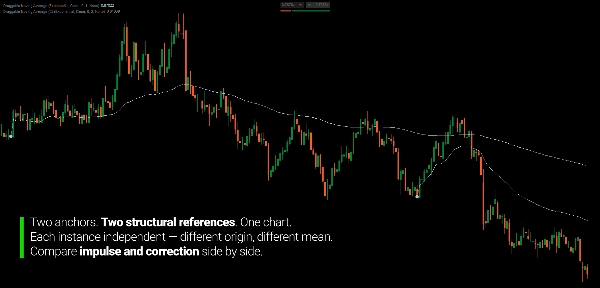
SUPPORT MULTI-INSTANCE
Chaque instance porte un ID d'Instance unique. Plusieurs instances peuvent fonctionner simultanément — une ancrée au début d'une correction, une autre à l'impulsion précédente — sans conflit d'icônes ou d'étiquettes.
FONCTIONNALITÉS CLÉS
- Icône d'ancrage déplaçable — placez-la sur n'importe quelle barre, faites glisser pour ajuster, la MM se met à jour instantanément
- Cinq types de MM (SMA, EMA, ALMA, KAMA, VWAP)
- Huit sources de prix (Ouverture, Haut, Bas, Clôture, Moyenne, Médiane, Typique, Pondéré)
- Limite de Période Max avec fenêtre roulante depuis l'origine de l'ancre
- Panneau de statistiques optionnel avec quatre positions d'angle
- Support multi-instance avec IDs d'Instance uniques
- Ancre persistante lors des changements d'échelle de temps
POUR QUI C'EST
Cet indicateur s'adresse aux traders qui analysent la structure du marché à travers les échelles de temps — en particulier ceux qui veulent mesurer le comportement des prix à partir d'un point de référence structurel défini plutôt qu'une période de recul arbitraire.
Si vous analysez les jambes correctives et impulsives sur des échelles de temps supérieures et devez évaluer cette même structure à une granularité inférieure, l'ancre déplaçable vous permet de marquer le point de départ structurel une fois et de le conserver à travers les vues d'échelle de temps. Ancrez sur le graphique journalier, passez à M15 — la référence tient.
Il convient aux traders swing et position qui pensent en termes de mouvements structurels plutôt que de périodes fixes, aux analystes multi-échelles qui ont besoin de points de référence cohérents entre les graphiques, et aux traders discrétionnaires qui veulent un ancrage précis et défini par l'utilisateur de la MM sans deviner la période.
Ce n'est pas un système de signaux. C'est un outil de mesure structurelle pour les traders qui pensent déjà en termes de mouvements de prix et veulent que leur moyenne mobile reflète ces mouvements précisément.
CE QUI LE REND DIFFÉRENT
Les moyennes mobiles standard sont basées sur la période. Leur référence est implicite — n barres en arrière depuis la barre actuelle. Lorsqu'un mouvement structurel se termine et qu'un nouveau commence, la période devient sans objet. Vous ne pouvez pas pointer une MM standard vers un événement spécifique.
Cet indicateur rend la référence explicite. Vous vous ancrez à un événement structurel. La MM mesure à partir de là. La période n'est pas l'entrée — c'est le point structurel.
Le résultat : une moyenne mobile qui reflète votre analyse structurelle réelle plutôt qu'une approximation de celle-ci.
---
COMPRENDRE LA MOYENNE MOBILE COMME UNE MOYENNE STRUCTURELLE
Les moyennes mobiles sont largement mal comprises comme des niveaux de support et de résistance. Les traders attendent que le prix "respecte" la MM 50 ou rebondisse sur la MM 200 comme si ces chiffres avaient une signification inhérente au marché. Ce n'est pas le cas.
Une moyenne mobile est une description arithmétique d'une distribution — le prix moyen sur une fenêtre définie. Ce qui détermine si cette ligne est significative n'est pas la formule. C'est si la fenêtre mesurée a une pertinence structurelle.
C'est pourquoi les MM basées sur la période sont fondamentalement limitées. Une MM de 50 périodes mesure les 50 dernières barres — une fenêtre sans relation avec un événement structurel. Elle ne correspond pas à l'endroit où une tendance a commencé ou où une correction a débuté. C'est une fenêtre roulante de longueur arbitraire dont la position est déterminée uniquement par la récence.
Lorsque vous vous ancrez à un point de pivot structurel, la MM devient la moyenne d'une distribution de prix spécifique et cohérente depuis cette origine vers l'avant. Lorsque le prix s'écarte bien au-dessus, les participants entrés à l'origine sont en extension. Lorsque le prix y revient, cela reflète un rééquilibrage de la distribution. Lorsque le prix la franchit proprement, le participant moyen depuis l'origine structurelle est à l'équilibre ou en perte — un changement de régime statistique, pas une ligne cassée.
La géométrie n'est pas la cause. C'est la description statistique d'une distribution structurelle dont vous avez défini les limites.
---
Le trading comporte des risques. Cet indicateur est un outil d'analyse technique — appliquez toujours une gestion appropriée des risques.


![Logo de "Smart Money Concepts (SMC) [Iridio Capital]"](https://cdn.ctrader.com/image/webp/28b69fd1-ef54-4bed-9487-07e78e883be4_40934)


