Description
Gap Guardian est un indicateur Fair Value Gap pour cTrader qui détecte et trace de véritables zones FVG de 3 chandeliers, maintient toutes les gaps valides visibles sur le graphique, et filtre optionnellement les signaux de trading selon la tendance et la logique des oscillations. Il prend également en charge l'atténuation dynamique des zones, les flèches de signal, ainsi que les niveaux automatiques d'Entrée / Stop Loss / Take Profit pour le dernier signal.
Description longue
Gap Guardian V48 est un indicateur visuel Fair Value Gap conçu pour les traders qui souhaitent un flux de travail FVG plus clair et plus pratique dans cTrader.
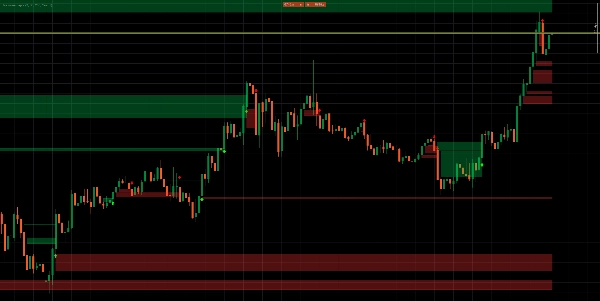
Cet indicateur se concentre sur de véritables Fair Value Gaps basés sur la mèche de 3 chandeliers uniquement. Il évite les interprétations lâches ou trompeuses basées sur le gap du corps et met en évidence uniquement les gaps authentiques où le prix a laissé une inefficacité claire entre le chandelier 1 et le chandelier 3.
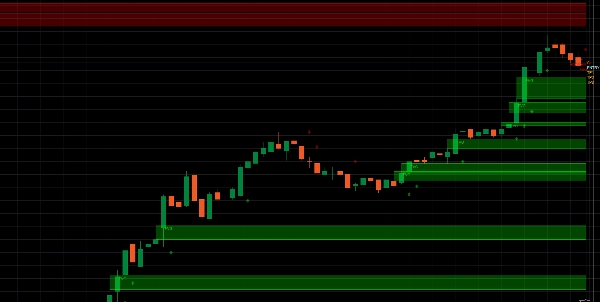
Toutes les zones FVG valides sont tracées sur le graphique, tandis que la génération de signaux peut être filtrée séparément. Cela offre aux traders le meilleur des deux mondes : une visibilité complète de la structure du marché et une logique de signal plus propre.
Principales caractéristiques
- Détecte de véritables Fair Value Gaps haussiers et baissiers de 3 chandeliers
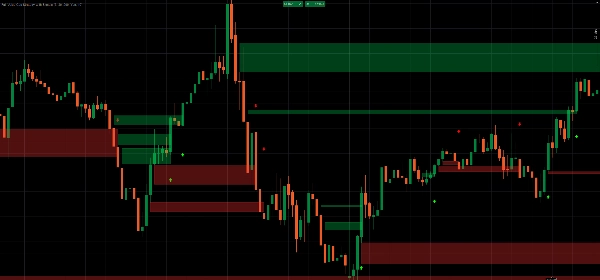
- Trace toutes les zones FVG valides directement sur le graphique
- Flèches de signal optionnelles pour les configurations qualifiantes
- Filtre de tendance optionnel pour les signaux
- Filtre premier FVG par oscillation optionnel
- Seul le dernier signal peut afficher les niveaux d'Entrée, SL et TP pour garder les graphiques propres
- Les flèches historiques restent visibles pour révision et analyse
- Les zones FVG peuvent rétrécir dynamiquement à mesure que le prix les atténue partiellement
- Les zones peuvent être supprimées automatiquement une fois complètement comblées
- Lueur, opacité, couleurs et décalage des flèches réglables
Comment ça fonctionne
Un FVG haussier est détecté lorsque le plus bas du chandelier 3 est au-dessus du plus haut du chandelier 1.
Un FVG baissier est détecté lorsque le plus haut du chandelier 3 est en dessous du plus bas du chandelier 1.
Cela maintient la logique stricte et cohérente avec les définitions classiques de Fair Value Gap.
Logique des signaux
L'indicateur peut afficher toutes les zones FVG, tout en appliquant des filtres uniquement aux signaux :
- Filtre de tendance utilisant EMA rapide et lente
- Logique premier FVG par oscillation
- Une flèche par chandelier par direction
Cela signifie que vous pouvez toujours voir chaque déséquilibre valide sur le graphique, tout en ne recevant que les signaux qui correspondent à vos conditions préférées.
Niveaux de trading
Pour le dernier signal qualifiant, l'indicateur peut automatiquement tracer :
- Entrée
- Stop Loss
- TP1
- TP2
- TP3
Cela aide les traders à visualiser rapidement les scénarios risque/rendement sans encombrer le graphique avec d'anciens ensembles de niveaux.
Personnalisation
Gap Guardian V48 inclut des réglages flexibles pour :
- Taille minimale du FVG en pips
- Visibilité des flèches et décalage des flèches
- Filtre de tendance activé ou désactivé
- Premier FVG par oscillation activé ou désactivé
- Couches de lueur et opacité
- Couleurs haussières et baissières
- Type d'entrée
- Marge de Stop Loss
- Multiplicateurs de TP
- Longueur d'extension des niveaux
- Nombre maximum de zones actives
Idéal pour
- Traders Fair Value Gap
- Traders d'action de prix
- Traders intraday et scalping
- Flux de travail concept Smart Money
- Traders souhaitant une visualisation FVG plus propre avec filtrage optionnel des signaux
Liste des fonctionnalités
- Détection FVG basée sur la mèche véritable
- Zones FVG haussières et baissières
- Flèches historiques
- Dernier signal Entrée / SL / TP
- Réduction partielle lors du comblement
- Suppression lors du comblement complet
- Filtre de tendance EMA
- Filtre de signal premier par oscillation
- Une flèche par chandelier par direction
- Personnalisation visuelle complète


