Description
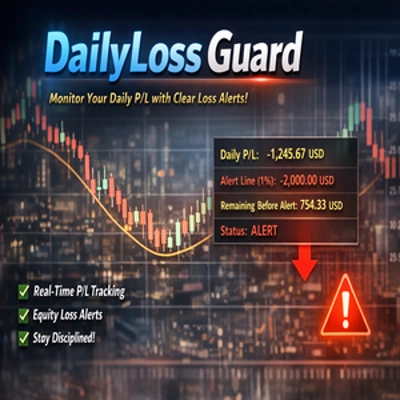
DailyLossGuard aide les traders à rester conscients de leur exposition au risque quotidien directement sur le graphique.
Cet indicateur calcule votre P/L quotidien total en combinant :
- le P/L réalisé des positions clôturées aujourd'hui
- le P/L non réalisé des positions actuellement ouvertes
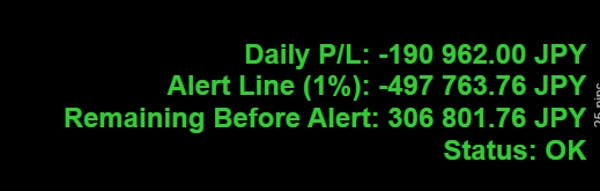
Lorsque votre perte quotidienne atteint le seuil en pourcentage que vous définissez en fonction des capitaux propres du compte, l'indicateur passe à un affichage d'avertissement rouge sur le graphique.
Il montre également combien de perte reste avant que l'alerte ne soit déclenchée, vous aidant à prendre des décisions de trading plus rapides et plus disciplinées.
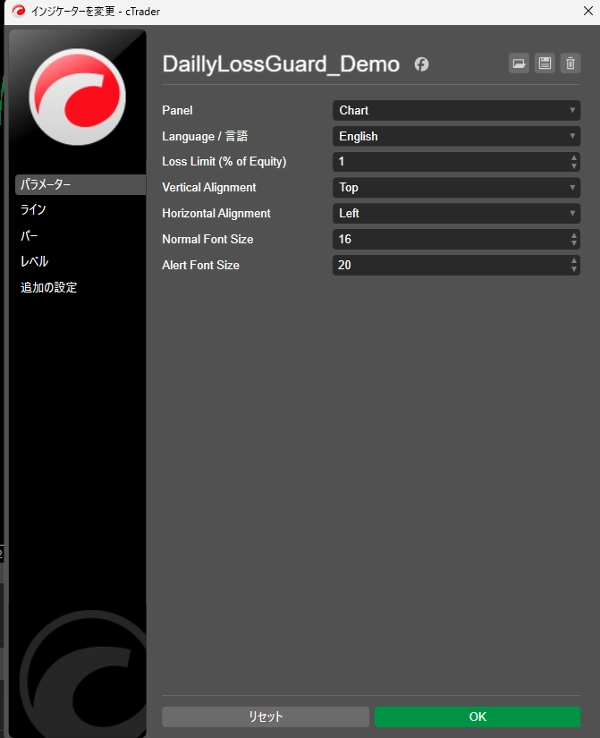
Conçu pour la clarté et la facilité d'utilisation, DailyLossGuard inclut un support d'affichage bilingue en anglais et japonais, le rendant adapté aux traders domestiques et internationaux.
Caractéristiques principales
- Surveillance en temps réel du P/L quotidien
- Inclut à la fois le P/L réalisé et non réalisé
- Alerte basée sur un pourcentage défini par l'utilisateur des capitaux propres du compte
- Texte d'avertissement rouge clair lorsque le seuil de perte est atteint
- Affiche la perte restante avant l'alerte
- Commutation de langue anglais / japonais
- Formatage des nombres facile à lire
- Affichage propre sur le graphique
Résumé
Avis clients
5 | 67 % | |
4 | 33 % | |
3 | 0 % | |
2 | 0 % | |
1 | 0 % |