
Mô tả
Hầu hết các chỉ báo xu hướng trả lời cùng một câu hỏi theo cùng một cách: làm mượt giá, vẽ một số đường, tìm các điểm giao cắt. Kênh Giá FDQ được xây dựng xoay quanh một câu hỏi khác — giá thực sự đang làm gì, loại bỏ nhiễu và trôi dạt, và điều đó cho bạn biết điều gì về nơi giá có khả năng sẽ đi?
Kết quả là một chỉ báo xu hướng dựa trên kênh kết hợp ba lớp phân tích riêng biệt thành một lớp phủ duy nhất, dễ đọc.
- Các điểm chính
Một điểm khởi đầu khác biệt. Chuỗi giá mà hầu hết các chỉ báo sử dụng, về mặt thống kê, là một vấn đề.
Giá thô mang thành phần đi ngẫu nhiên làm mờ cấu trúc có ý nghĩa. Trước khi vẽ bất kỳ kênh nào, FDQ áp dụng biến đổi phân biệt phân đoạn — một kỹ thuật mượn từ nghiên cứu định lượng — loại bỏ sự trôi dạt này trong khi cố ý giữ lại bộ nhớ dài hạn trong dữ liệu. Những gì còn lại là một chuỗi biến đổi vẫn phản ánh nơi thị trường đã từng đến, nhưng không còn bị chi phối bởi nơi nó đang ở hiện tại. Đây là nền tảng mà mọi thứ khác được xây dựng trên đó.
- Nhiễu có chi phí
Mỗi phương pháp làm mượt dựa trên độ trễ đều đánh đổi thời gian lấy độ chính xác. Bộ lọc Kalman thì không.
Bộ lọc Kalman là một quá trình ước lượng đệ quy: nó liên tục cập nhật quan điểm về thị trường, cân bằng mức độ tin tưởng vào dữ liệu mới so với những gì đã thiết lập. Không giống như trung bình động, nó không có cửa sổ nhìn lại cố định và không đối xử với tất cả các thanh quá khứ như nhau. Kết quả là một biểu diễn giá sạch hơn, phản ứng nhanh với các chuyển động thực sự và chống lại phản ứng với nhiễu — không có các tín hiệu bị trì hoãn mà việc làm mượt thường tạo ra.
- Các dải được xây dựng từ hành vi, không phải công thức
Các dải độ lệch chuẩn giả định giá phân phối chuẩn. Thực tế hiếm khi như vậy.
Các giới hạn kênh FDQ được xác định bằng phân tích phân vị — phân phối thống kê thực tế của giá biến đổi trong khoảng thời gian nhìn lại. Dải trên đánh dấu mức mà chuỗi thực sự đạt tới ở cực trên của phạm vi; dải dưới làm điều tương tự ở cực dưới. Đây không phải là các giới hạn lý thuyết tính từ trung bình — chúng phản ánh nơi giá thực sự đã giao dịch, điều này làm cho chúng phản ứng nhanh hơn với cách thị trường thực sự hành xử tại bất kỳ thời điểm nào.
- Một lớp thứ hai bên trong kênh
Các dải ngoài định nghĩa phạm vi. Các dải trong định nghĩa vùng.
Một bộ dải thứ hai nằm tỷ lệ giữa kênh ngoài và đường giữa của nó. Lớp trong này tạo ra một vùng giao dịch riêng biệt — hẹp hơn toàn bộ kênh, dựa trên cùng nền tảng thống kê — phục vụ như một tham chiếu có cấp độ cho các điểm vào lệnh và phân loại tín hiệu.
- Trạng thái xu hướng trước mọi thứ khác
Một tín hiệu không có ngữ cảnh chỉ là dữ liệu ngẫu nhiên.
Chỉ báo theo dõi trạng thái hướng của kênh liên tục, sử dụng cơ chế bỏ phiếu đa số qua ba thành phần dải. Khi ít nhất hai trong ba thành phần di chuyển cùng hướng, trạng thái xu hướng được xác nhận là Tăng hoặc Giảm. Tín hiệu chỉ được tạo ra khi phù hợp với trạng thái hiện tại — các thiết lập mua chỉ trong điều kiện Tăng, các thiết lập bán chỉ trong điều kiện Giảm. Khi thị trường không đạt ngưỡng này, không có trạng thái nào được công bố và không có tín hiệu nào được tạo ra. Các chuyển đổi giữa các trạng thái được đánh dấu bằng các đường thẳng đứng trực tiếp trên biểu đồ.
- Ba thiết lập hồi phục riêng biệt
Không phải tất cả các đợt hồi đều giống nhau. Chỉ báo nhận biết ba mức độ.
Khi trạng thái xu hướng đang hoạt động, chỉ báo quan sát các mẫu hồi phục cụ thể — những khoảnh khắc giá di chuyển ngược xu hướng, chạm mức xác định và đảo chiều trở lại qua mức đó.
-
- Hồi giữa — Giá giảm xuống dưới (hoặc tăng lên trên) đường giữa kênh và hồi phục. Một đợt hồi chuẩn trong xu hướng.
- Hồi sâu — Giá mở rộng hơn nữa, chạm cực dải trong trước khi hồi phục. Một đợt hồi cam kết hơn với sự đảo chiều quyết đoán hơn.
- Hồi nhẹ — Giá chạm dải trong ở phía xu hướng và bật lại. Là mức nông nhất trong ba loại, xảy ra thường xuyên nhất.
Mỗi loại có hình ảnh riêng biệt trên biểu đồ và có thể được bật hoặc tắt độc lập.
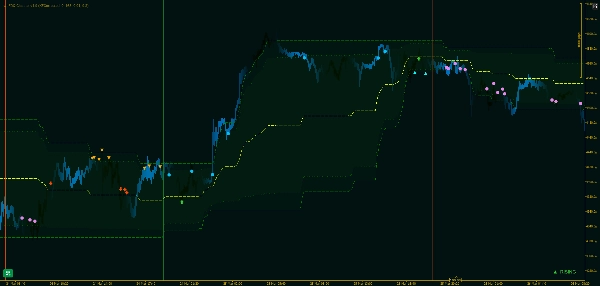
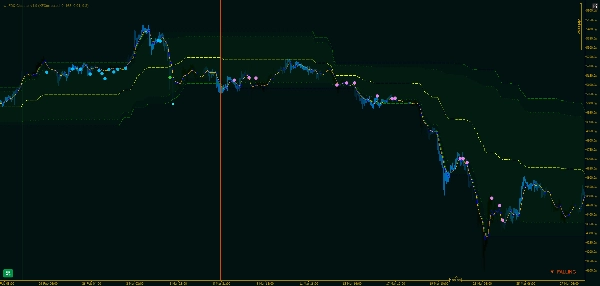
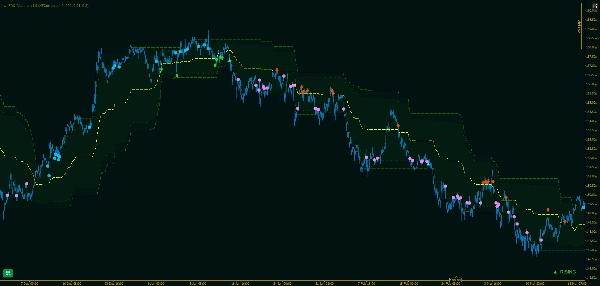
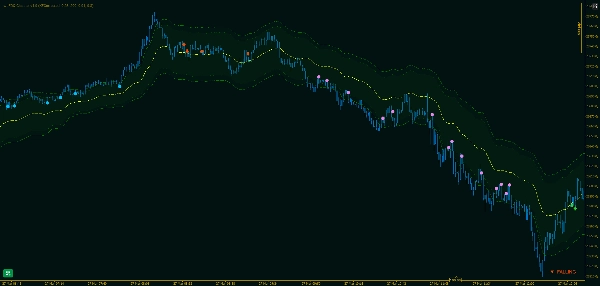
- Những gì bạn thấy
Biểu đồ kể câu chuyện trực tiếp, không cần giải thích.
Kênh chính, các dải trong và đường giữa phủ lên giá dưới dạng các đường liên tục. Các chuyển đổi chế độ được đánh dấu bằng các đường thẳng đứng — màu xanh cho Tăng, màu đỏ cho Giảm — để lịch sử thay đổi trạng thái xu hướng có thể nhìn thấy ngay lập tức. Các dấu hiệu tín hiệu xuất hiện tại thanh mà mỗi đợt hồi được xác nhận, với các biểu tượng riêng biệt cho từng loại tín hiệu và hướng.
- Tại sao phương pháp này bền vững
Hầu hết các chỉ báo kênh đều bị trễ khi thị trường di chuyển nhanh và phản ứng quá mức khi không di chuyển.
Bởi vì kênh FDQ được xây dựng trên biến đổi giữ trạng thái ổn định và giữ bộ nhớ thay vì trung bình cuộn, các dải điều chỉnh theo phân phối hành vi thực tế thay vì đuổi theo giá. Lớp Kalman giữ cho ước lượng cơ sở sạch sẽ mà không gây ra chi phí thời gian đi kèm với việc làm mượt theo cửa sổ. Kết quả là một kênh vẫn có ý nghĩa trong các điều kiện thị trường khác nhau — xu hướng, dao động và chuyển tiếp — mà không cần điều chỉnh thủ công.
Tóm tắt
The channel boundaries are defined by quantile analysis of the transformed price distribution rather than standard deviation, capturing actual price extremes over the lookback period. It features outer bands marking the full range and inner bands creating a narrower trading zone for refined entry signals. The indicator continuously tracks trend direction using a majority vote across three band components, confirming Rising or Falling states and marking transitions with vertical lines on the chart.
Within active trends, wt.FDQ Channel identifies three distinct rebound setups—Light, Mid, and Deep—each representing different pullback intensities and reversal confirmations. These signals are visually distinct and configurable. The overlay displays the primary channel, inner bands, midline, trend states, and rebound signals directly on the price chart, supporting analysis across various markets including Forex, indices, and cryptocurrencies.
Đánh giá của khách hàng
5 | 100 % | |
4 | 0 % | |
3 | 0 % | |
2 | 0 % | |
1 | 0 % |


