Beschreibung
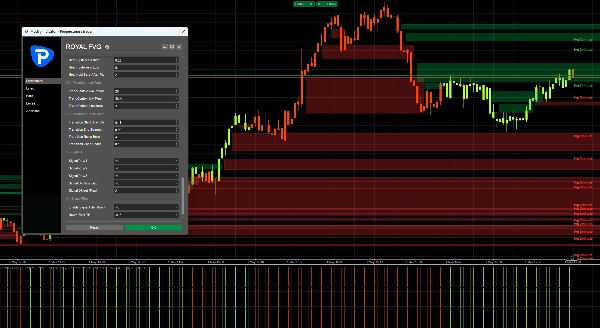
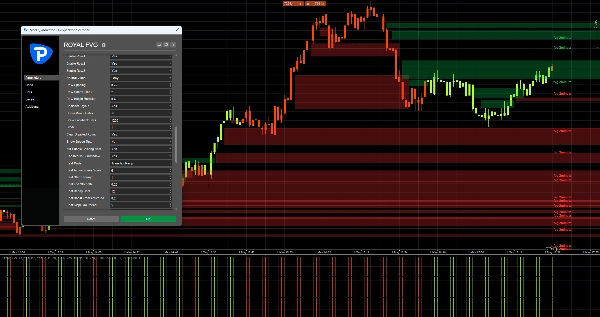
Royal FVG MTF X is an advanced multi-timeframe Fair Value Gap indicator built to detect, visualize, and track institutional imbalance zones directly on the chart.
The indicator identifies bullish and bearish Fair Value Gaps using configurable candle logic and displays them as dynamic price zones. These zones represent areas where price moved with strong imbalance, leaving behind potential liquidity, inefficiency, and future reaction areas.
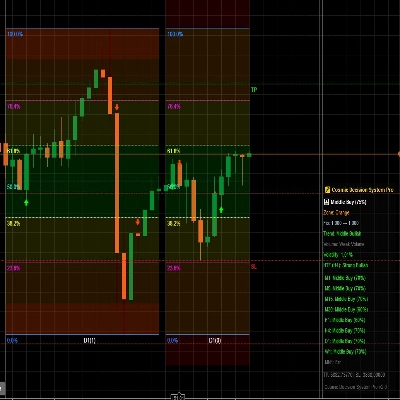
Royal FVG MTF X is designed for traders who use smart money concepts, liquidity concepts, imbalance trading, market structure, and multi-timeframe confirmation. It combines chart-based FVG zones with a dedicated multi-timeframe heatmap panel, giving traders both visual price zones and directional context in one tool.
The indicator can track active and filled gaps, show partial fill progress, filter out oversized session gaps, and generate optional triangle signals when important FVG events occur. This makes it useful for spotting possible continuation areas, reversal zones, liquidity reactions, and high-probability market imbalances.
How It Works
Royal FVG MTF X scans the selected chart or an alternate source timeframe for Fair Value Gaps. A Fair Value Gap is detected when price creates an imbalance between a group of candles, leaving a gap between earlier candle prices and later candle prices.
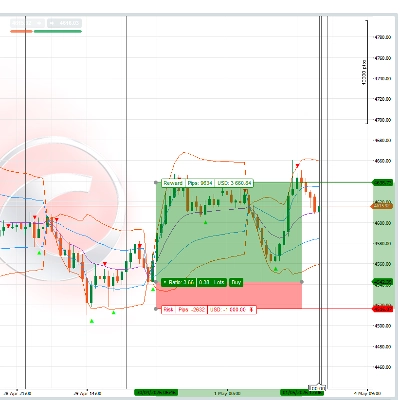
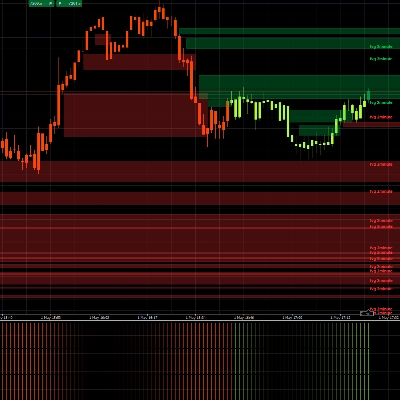
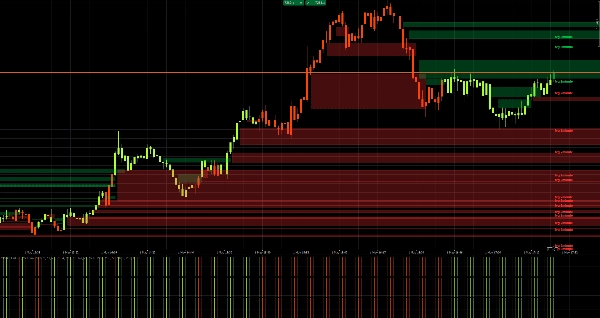
When a valid bullish or bearish FVG is found, the indicator draws a colored zone on the main chart. The zone can extend to the right, remain active until filled, and optionally show partial fill progress as price moves back into the imbalance.
The indicator supports:
Bullish FVG zonesBearish FVG zonesActive imbalance zonesFilled imbalance zonesPartial fill trackingAlternate timeframe FVG detectionMulti-timeframe FVG heatmap rowsOptional triangle signalsTrend-based heat coloringLarge gap filteringMaximum FVG size filtering
Chart FVG Engine
The chart engine detects Fair Value Gaps from the active chart timeframe or from a selected alternate timeframe.
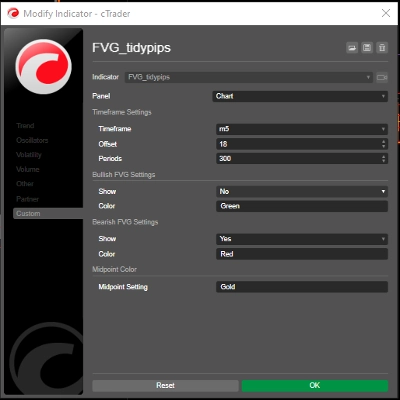
For example, traders can view M5 FVG zones while trading on an M1 chart, or display chart-timeframe FVG zones directly on the current chart.
When a new FVG is detected, Royal FVG MTF X draws a rectangle zone between the imbalance boundaries. The opacity of the zone can be based on displacement strength, making stronger moves visually more noticeable.
If price later returns into the FVG, the indicator can track how much of the zone has been filled. Once the zone is fully filled based on the indicator logic, it can either remain visible in a faded style or be removed depending on the user settings.
Multi-Timeframe Heatmap
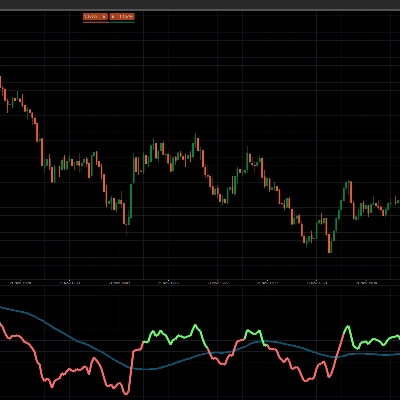
Royal FVG MTF X also includes a compact multi-timeframe heatmap panel with up to three visible rows. Each row can monitor a different timeframe.
The heatmap does not simply show random colors. It reacts to FVG behavior and the state of active imbalance zones. When a bullish or bearish imbalance is filled or removed on a closed candle, the row direction can shift and display the new directional context.
This allows traders to quickly see whether multiple timeframes are showing bullish or bearish FVG pressure.
Signal System
The indicator includes optional signal logic. Signals can be enabled per row and can appear when an FVG event happens on that timeframe.
A buy-style triangle can appear when bullish directional conditions are detected, while a sell-style triangle can appear when bearish directional conditions are detected.
Royal FVG MTF X also includes an optional invisible Row 4 filter. This filter can be used as an extra confirmation layer, allowing signals only when the selected filter timeframe agrees with the row signal direction.
Heat Modes
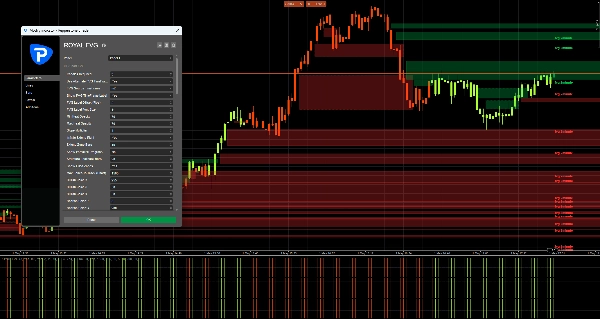
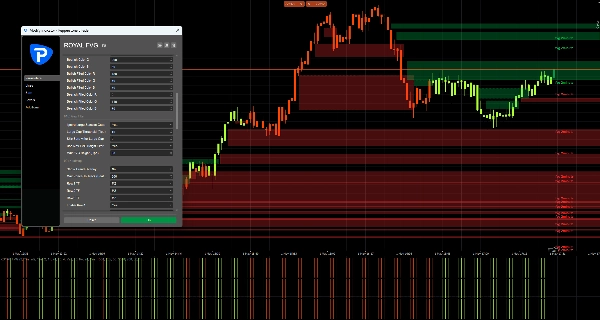
Royal FVG MTF X includes several heat modes to control how the subwindow rows and optional candle coloring behave.
Trend Decay starts with stronger heat when a directional event happens and gradually fades over time.
Slope Bias blends FVG direction with moving average slope and ATR-normalized strength.
Chart Trend Blend adjusts the heat color depending on whether the FVG direction agrees with the chart trend.
Trend Context compares FVG direction with a broader moving average trend context.
Transition Ramp gradually increases heat after a transition, helping visualize developing momentum.
Filters and Protection
To keep the chart cleaner, Royal FVG MTF X includes filters for abnormal or oversized gaps.
The large session gap filter can ignore gaps caused by market opens, weekend gaps, or sudden session jumps. The maximum FVG height filter can also prevent extremely large imbalance zones from being drawn.
These filters help the indicator focus on more useful Fair Value Gap zones instead of cluttering the chart with oversized or low-quality areas.
Short Marketplace-Style Version
Royal FVG MTF X is a powerful multi-timeframe Fair Value Gap and imbalance indicator designed for smart money and liquidity-based trading. It automatically detects bullish and bearish FVG zones, tracks active and filled imbalances, displays partial fill progress, and adds a multi-timeframe heatmap for directional confirmation.
With optional triangle signals, alternate timeframe detection, trend-based heat modes, large gap filtering, and an optional signal confirmation filter, Royal FVG MTF X gives traders a complete visual framework for spotting imbalance zones, liquidity reactions, and high-probability FVG setups.
Disclaimer
Royal FVG MTF X is a technical analysis tool and does not guarantee profitable trades. It should be used together with proper risk management, market structure analysis, and a complete trading plan.