Описание
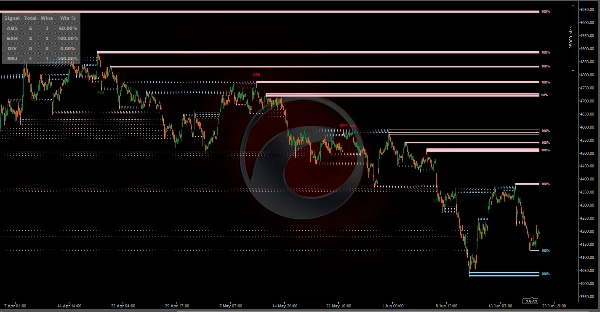
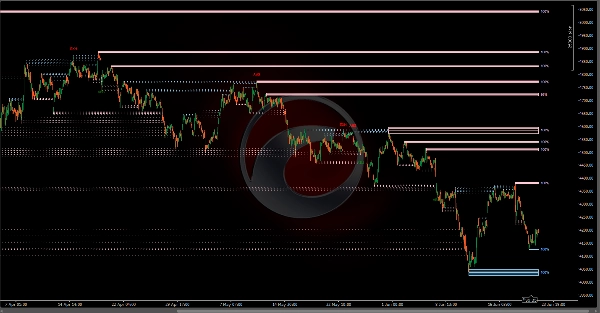
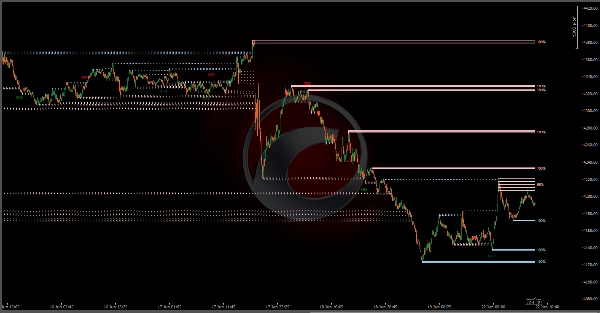
Инструмент Liquidity Profiler Tools — это индикатор, который определяет основные уровни ликвидности со стороны покупателей и продавцов и визуализирует внутреннюю активность покупателей/продавцов через квадранты, заполненные дельтой объема, предоставляя полный набор инструментов для анализа ликвидностных пробоев и потенциальных разворотов.
Обнаружение
Индикатор использует систему обнаружения на основе пивотов. Когда подтверждается локальный максимум, создается зона ликвидности со стороны покупателей (BSL); локальный минимум создает зону ликвидности со стороны продавцов (SSL). В скрипте реализована логика "Фильтрация перекрытий" для обеспечения ясности на графике. Если в пределах существующей активной зоны формируется новый, более значимый пивот, инструмент может автоматически обновить уровень до наиболее релевантного, предотвращая захламление множеством перекрывающихся прямоугольников.
Этот инструмент делит каждую зону на четыре горизонтальных квадранта. По мере того как цена торгуется внутри этих квадрантов, скрипт рассчитывает дельту объема (разницу между покупательским и продавательским давлением) для каждого конкретного участка.
Зоны покупок: указывают, что агрессивные покупатели были более активны в этом конкретном ценовом диапазоне.
Зоны продаж: указывают, что агрессивные продавцы доминировали в этом участке.
Обнаружение разворотов
В скрипте реализована система обнаружения, которая выявляет необычные объемные паттерны во время ликвидностных пробоев. Эти сигналы отображаются в виде текста следующим образом:
-
- ABS (Поглощение): происходит, когда агрессивные рыночные ордера на крайнем краю зоны поглощаются крупными лимитными ордерами в противоположном направлении.
- EXH (Истощение): происходит, когда пробой происходит при очень низком относительном объеме, что указывает на отсутствие продолжения.
- DIV (Дивергенция): выявляется, когда высокий объем толкает цену к краю зоны (FOMO), но цена не закрывается за пределами уровня.
- REJ (Отскок-отклонение): срабатывает, когда свеча пробоя показывает высокую дельту в противоположном направлении пробоя и закрывается обратно внутри зоны.
Панель управления:
Индикатор включает панель управления в реальном времени, которая отслеживает историческую эффективность каждого типа сигнала разворота с использованием логики проверки на основе времени.
Выигрыш фиксируется, если в пределах окна оценки (Eval Window) цена разворачивается от пробоя и остается в прибыли (на правильной стороне входа по сигналу) в течение определенного количества последовательных баров (Hold Time).
Ухудшение зоны (Состояние):
Активные зоны имеют метку с процентом "Состояния". Она отслеживает накопленный объем, пройденный внутри зоны относительно ее емкости. По мере того как на этих уровнях проходит больше объема, ликвидность считается "поглощенной", и процент снижается к 0%.
Настройки индикатора
Основные настройки
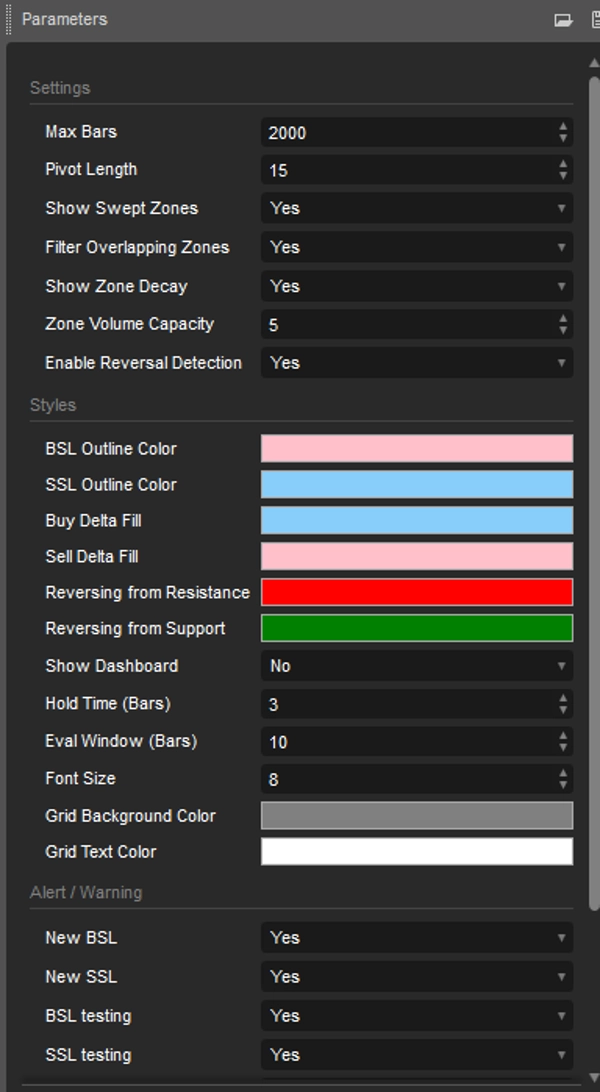
- Длина пивота: период назад/вперед для обнаружения локальных максимумов и минимумов.
- Максимум баров: Индикатор начинает вычисления на основе количества исторических свечей.
- Показывать пробитые зоны: сохраняет зоны видимыми с пунктирными контурами после их пробоя.
- Фильтровать перекрывающиеся зоны: предотвращает создание новых зон, которые перекрываются с существующими активными зонами.
Ухудшение и развороты
- Показывать ухудшение зоны: Включает/выключает метки процента состояния.
- Емкость объема зоны: Множитель для среднего объема, определяющий, сколько объема зона может поглотить.
- Включить обнаружение разворотов: Включает/выключает сигнальные пузырьки для паттернов разворота.
Панель управления
- Показывать панель управления: Включает/выключает таблицу отслеживания эффективности.
- Время удержания (бары): Количество последовательных баров, в течение которых цена должна оставаться в прибыли, чтобы считаться успешным разворотом.
- Окно оценки (бары): Максимальное количество баров, в течение которых скрипт ожидает проявления разворота.
Стили и оповещения
- Стили: Настройка цвета объектов. Скрыть/показать панель управления.
- Оповещения: Включение/выключение оповещений при обнаружении/миграции/тестировании/развороте BSL и SSL.
Сводка
The tool also detects potential reversal signals during liquidity sweeps, displaying four types of volume-based patterns: Absorption (ABS), Exhaustion (EXH), Divergence (DIV), and Snapback Rejection (REJ). These signals help identify unusual volume behavior that may precede price reversals.
A real-time dashboard tracks the historical performance of reversal signals, validating them based on price action within a user-defined evaluation window and hold time. Active zones feature a "Health" metric indicating the extent of volume consumed relative to zone capacity, reflecting liquidity depletion.
Users can customize settings including pivot length, volume capacity, zone visibility, reversal detection toggles, and dashboard display. The indicator supports visualization of liquidity sweeps and reversals, aiding analysis of support and resistance levels through volume and order flow insights.