Memperkenalkan Relative Moving Average (RMA) indikator, sekarang tersedia untuk cTrader!
The Relative Moving Average (RMA) — juga dikenal sebagai Smoothed Moving Average (SMMA) — adalah jenis moving average yang bertujuan mengurangi lag sambil mempertahankan kelancaran pada kurva. Ini adalah formula yang sama yang digunakan oleh fungsi “RMA” bawaan TradingView, yang banyak digunakan dalam indikator populer seperti Relative Strength Index (RSI).
RMA dirancang untuk menyeimbangkan antara responsivitas dan stabilitas. Ini memperbarui dengan lebih halus dibandingkan Exponential Moving Average (EMA) tetapi bereaksi lebih cepat terhadap perubahan harga dibandingkan Simple Moving Average (SMA).
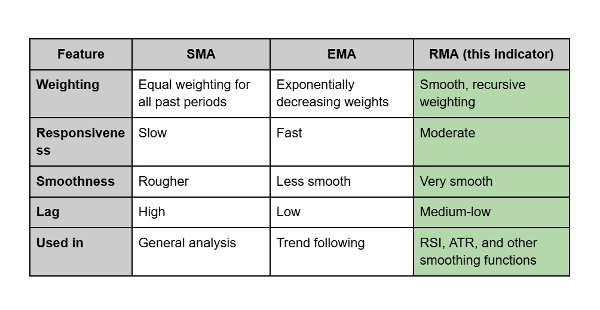
Perbedaannya:
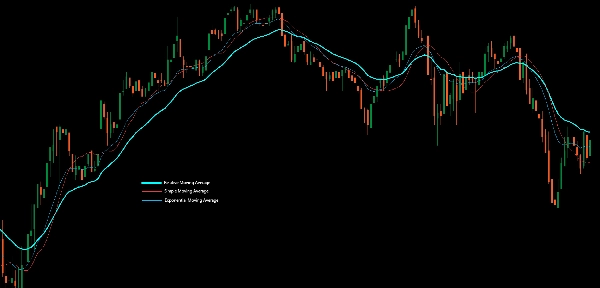
- The SMA merata-rata semua harga secara sama, menyebabkan lag dan ketidakteraturan.
- The EMA memberikan bobot lebih pada harga terbaru, membuatnya sangat responsif tetapi kadang berisik.
- The RMA, sebaliknya, menggabungkan manfaat keduanya: meratakan volatilitas sambil mempertahankan reaksi tepat waktu terhadap pergeseran harga.
Penggunaan Praktis:
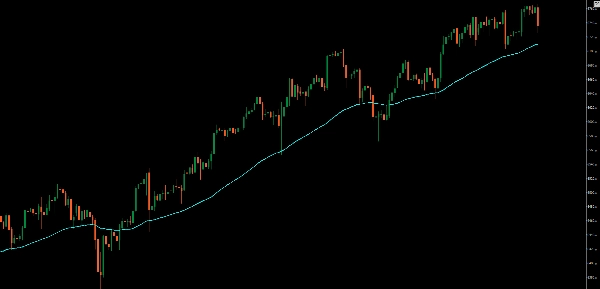
Trader sering menggunakan RMA sebagai garis tren yang lebih halus atau sebagai bagian dari indikator momentum. Ini sangat efektif ketika Anda ingin menyaring noise tanpa memperkenalkan lag yang signifikan — ideal untuk mengonfirmasi tren jangka panjang atau mendukung analisis overbought/oversold.


