
WAVETREND_withSourceCode
Indikator
Versi 1.0, Oct 2025
Windows, Mac
5.0
Ulasan: 2
Deskripsi
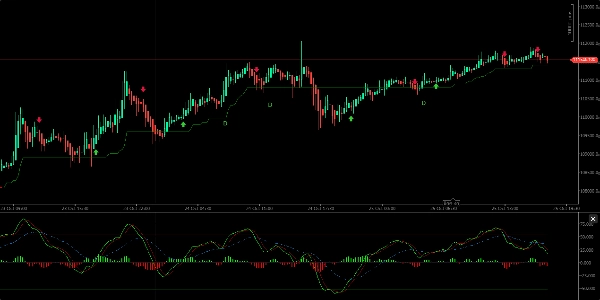
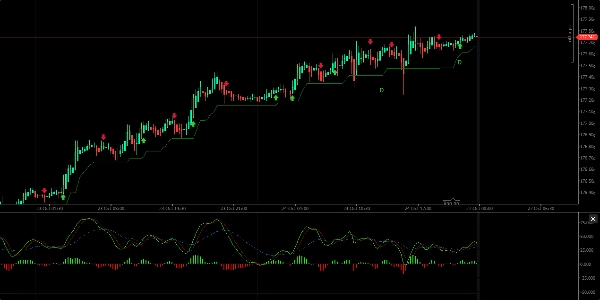
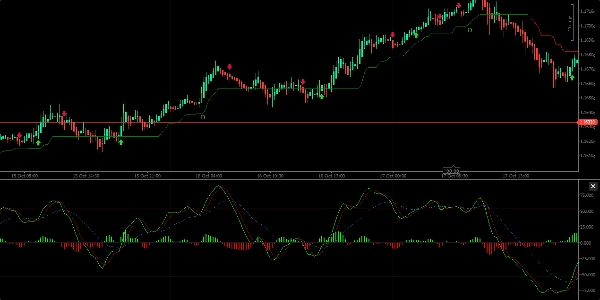
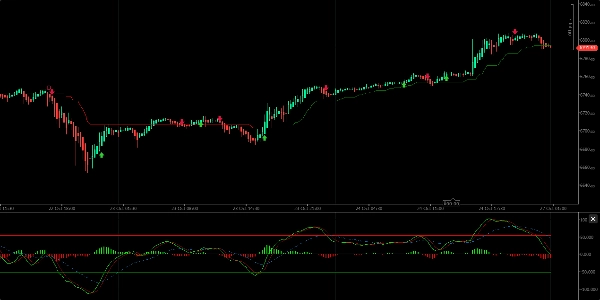
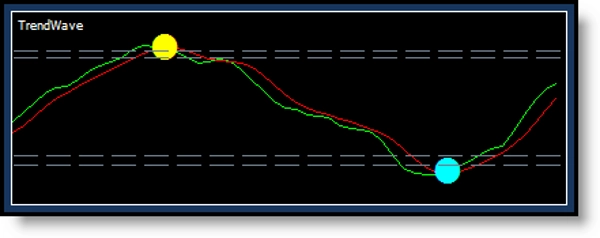
Ini menyediakan sinyal beli-jual, indikasi arah tren, dan mengidentifikasi zona jenuh beli dan jenuh jual. Secara visual, ini terdiri dari dua garis nilai dengan awan/histogram di tengah, yang bergerak di atas dan di bawah garis tengah, mewakili tren naik atau turun.
Fitur Utama:
- Sinyal beli terjadi ketika garis hijau melintasi garis merah ke atas; sinyal jual ketika garis hijau melintasi ke bawah.
- Ini menunjukkan arah tren dengan gelombang awan di atas atau di bawah garis tengah.
- Indikator menampilkan titik hijau (beli) dan merah (jual) pada titik persilangan, dengan perubahan warna lilin yang sesuai (kuning untuk beli, pirus untuk jual).
- Terbaik digunakan pada interval 12 jam atau 1 hari untuk menghindari kebisingan jangka pendek yang berlebihan.
- Indikator dapat mengidentifikasi divergensi antara harga dan momentum (divergensi bullish dan bearish reguler), yang menandakan potensi pembalikan harga.
- Disarankan untuk menggabungkan WaveTrend dengan indikator lain seperti WMA, CMF, RSI, dan MACD untuk keputusan perdagangan yang lebih dapat diandalkan.
Secara keseluruhan, WaveTrend adalah alat fungsional yang berguna untuk mengidentifikasi arah tren dan sinyal perdagangan tetapi harus digunakan bersama alat analisis lain untuk konfirmasi.
Ringkasan
Profil indikator
Ulasan pelanggan
5.0
Ulasan: 2
5 | 100 % | |
4 | 0 % | |
3 | 0 % | |
2 | 0 % | |
1 | 0 % |
Ulasan pelanggan
November 6, 2025
the main upside is the trade idea gets slowed down first. The setup still needs say no.
Diskusi
Pertanyaan umum
Signal
ZigZag
EURUSD
Supertrend
GBPUSD
RSI
XAUUSD
NAS100
ATR
MACD
Produk-produk yang tersedia melalui cTrader Store, termasuk bot trading, indikator, dan plugin, disediakan oleh pengembang pihak ketiga serta hanya ditujukan untuk akses teknis dan informasi. cTrader Store bukan broker dan tidak menyediakan saran investasi, rekomendasi pribadi, atau jaminan apa pun tentang kinerja di masa mendatang.


![Logo "[Stellar Strategies] Inside Bar with Signals"](https://cdn.ctrader.com/image/webp/1d9e8bfa-3b2c-4440-bb37-5856902008a7_30683)


Harga
Sejak 16/03/2025
256
Instal gratis