Deskripsi
🚀 Ubah Grafik Anda menjadi Pusat Keputusan Strategis
Smart Tech Analysis bukan sekadar indikator.
Ini adalah dasbor analisis cerdas lengkap, dikembangkan untuk trader yang menginginkan kejelasan, presisi, dan kelincahan dalam pengambilan keputusan.
Sementara sebagian besar indikator hanya memberikan informasi terpisah, Smart Tech Analysis mengintegrasikan:
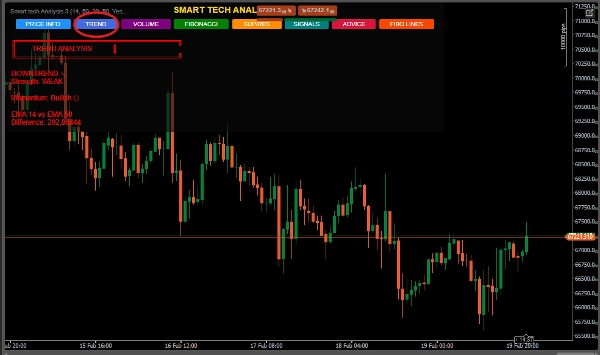
✔ Tren
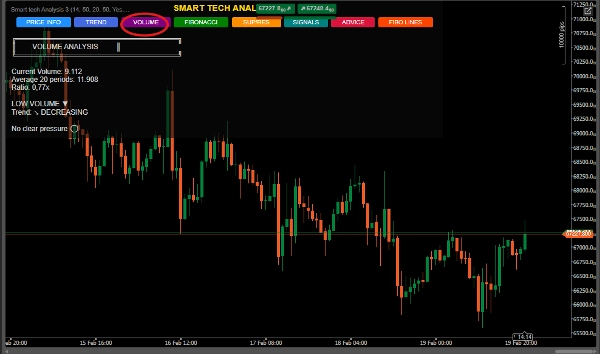
✔ Volume
✔ Fibonacci
✔ Support dan Resistance
✔ Sinyal Teknis
✔ Rekomendasi Operasional
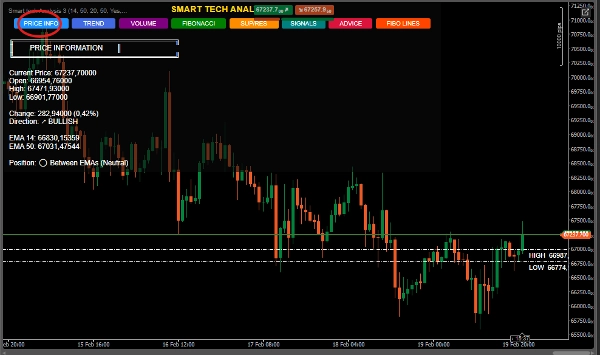
✔ Informasi Harga Detail
Semua dalam satu dasbor dinamis dan interaktif.
🔥 PERBEDAAN BESAR
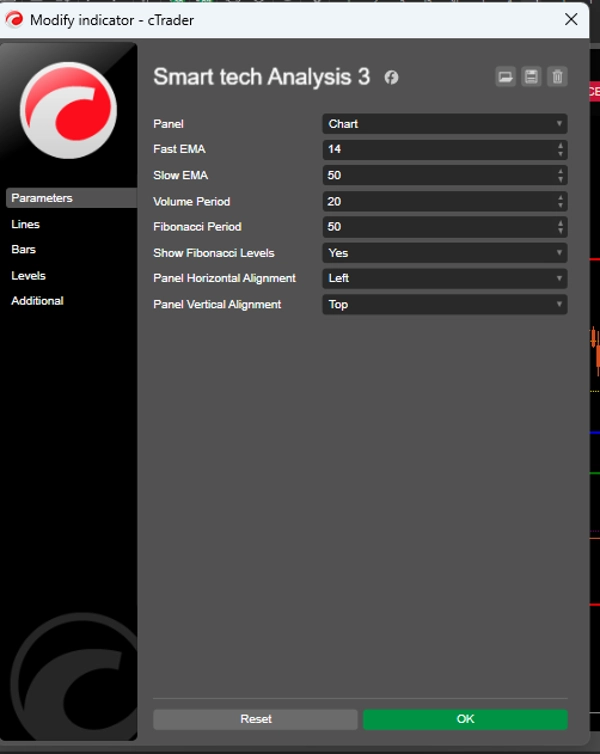
🎯 1. Sistem 6-dalam-1 – Analisis Terintegrasi
Anda tidak perlu lagi beralih antara banyak indikator.
Smart Tech Analysis menggabungkan:
📈 EMA cepat dan lambat (14 dan 50)
📊 Volume dengan analisis komparatif
🧩 Fibonacci otomatis
🛡 Support dan resistance dinamis
🚦 Pembuatan sinyal cerdas
📌 Rekomendasi dengan stop dan target yang dihitung
👉 Ini mengurangi kebisingan visual dan meningkatkan objektivitas.
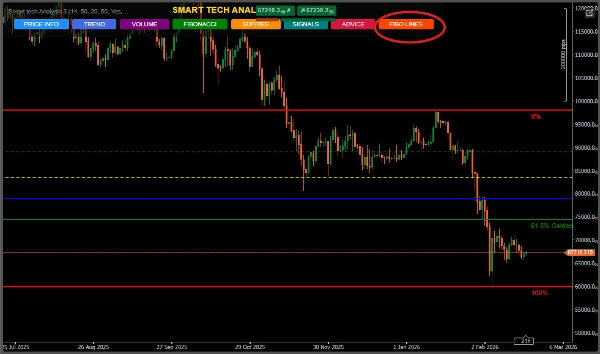
🧠 2. Panel Interaktif Eksklusif
Antarmuka profesional dengan tombol pintar:
INFO HARGA
TREN
VOLUME
FIBONACCI
SUP/RES
SINYAL
SARAN
Trader memilih tepat apa yang ingin mereka lihat.
📌 Organisasi.
📌 Kontrol.
📌 Profesionalisme.
📈 3. Analisis Tren dengan Kekuatan dan Momentum
Ini tidak hanya menunjukkan apakah naik atau turun.
Ini menghitung:
Intensitas tren
Persentase kekuatan antara EMA
Klasifikasi: Lemah, Sedang, atau Kuat
Ini menghindari entri lemah di pasar sideways.
📊 4. Volume dengan Pembacaan Institusional
Sistem mengidentifikasi:
Volume ekstrem
Tekanan beli atau jual
Percepatan atau perlambatan
Perbandingan dengan rata-rata historis
👉 Ideal untuk mendeteksi kemungkinan aktivitas institusional.
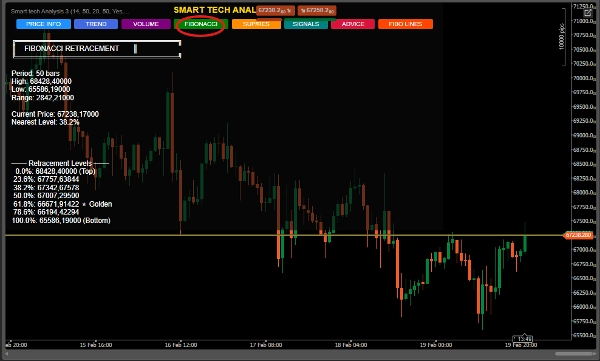
🧩 5. Fibonacci Otomatis dengan Zona Emas
Dihitung secara dinamis selama periode yang ditentukan.
Sorotan khusus untuk:
⭐ Zona 61,8% (Zona Emas)
📌 Identifikasi level terdekat
📌 Ekstensi bullish dan bearish
📌 Rekomendasi kontekstual otomatis
Sempurna untuk trader retracement dan swing trader.
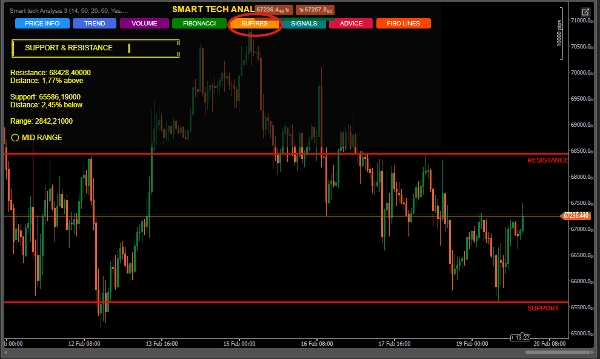
🛡 6. Support & Resistance Cerdas
Mendeteksi titik tertinggi dan terendah yang relevan
Menampilkan jarak persentase dari harga saat ini
Mengklasifikasikan posisi: Dekat support, resistance, atau mid-range
Menggambar garis otomatis pada grafik
Ideal untuk memasuki zona strategis.
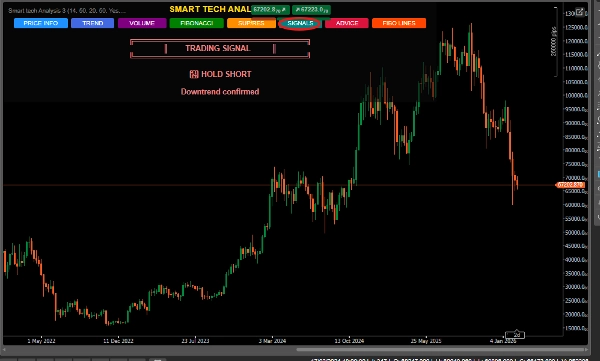
🚦 7. Sistem Sinyal Konfluensi
Algoritma tidak menghasilkan sinyal acak.
Ini menggabungkan:
✔ Crossover EMA
✔ Kedekatan dengan support/resistance
✔ Struktur tren
✔ Konteks harga
Klasifikasi:
🟢 BELI KUAT
🔴 JUAL KUAT
📈 TAHAN LONG
📉 TAHAN SHORT
⏸ TUNGGU
Dengan tingkat kepercayaan yang ditunjukkan.
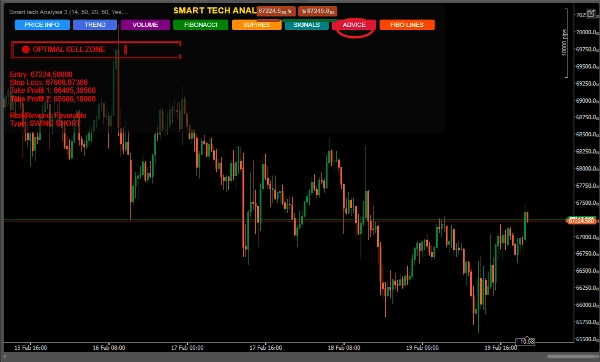
🎯 8. Rekomendasi dengan Manajemen Risiko
Panel "SARAN" memberikan:
Masuk yang disarankan
Stop Loss Teknis
Dua target Take Profit
Struktur swing (Long atau Short)
Konteks operasi
👉 Ini bukan sekadar analisis.
👉 Ini adalah rencana terstruktur.
🏆 Untuk siapa indikator ini?
✔ Trader pemula yang membutuhkan kejelasan
✔ Trader menengah yang menginginkan konfluensi
✔ Trader mahir yang mencari efisiensi
✔ Swing trader
✔ Scalper yang menggunakan konfirmasi struktural
💎 Mengapa menonjol di pasar? Indikator Umum Smart Tech Analysis
Informasi Terpisah Analisis Terintegrasi Polusi Visual Dasbor Terorganisir Tanpa Konteks Konfluensi Teknis Tanpa Manajemen Stop dan Target yang Disarankan Sinyal Sederhana Sinyal dengan Konfirmasi
📊 Manfaat Langsung
✔ Mengurangi keputusan emosional
✔ Meningkatkan akurasi
✔ Meningkatkan pembacaan struktural
✔ Menghemat waktu
✔ Meningkatkan standar profesional trader
🧠 Posisi Pasar
Smart Tech Analysis ideal untuk:
Pasar Forex
Indeks
Komoditas
Cryptocurrency


