
Deskripsi
PEMDETeksi AYUNAN
Titik Ayunan Struktural + Fibonacci Retracement + RSI
--------------------------------------------------
INDIKATOR GRATIS
Identifikasi ayunan struktural. Lihat tren. Berdagang dengan konfluensi.
--------------------------------------------------
APA YANG DILAKUKAN INDIKATOR INI
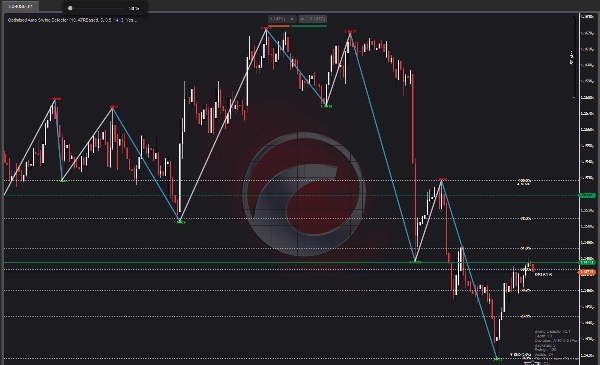
Swing Detector mengidentifikasi ayunan tinggi dan rendah struktural menggunakan deteksi ekstrem lokal dengan kedalaman yang dapat dikonfigurasi dan penyaringan deviasi otomatis.
Kemudian menghubungkan ayunan dengan garis tren, menampilkan level retracement Fibonacci standar, dan menampilkan nilai RSI saat ini di dekat harga.
--------------------------------------------------
FITUR UTAMA
- Deteksi titik ayunan (kedalaman dapat dikonfigurasi)
- DEVASI OTOMATIS: Penyaringan berbasis ATR menyesuaikan dengan timeframe apa pun
- Mode deviasi pip tetap (untuk kontrol manual)
- Garis tren ayunan (ayunan naik biru, ayunan turun oranye)
- RETRACEMENT FIBONACCI (0, 23.6, 38.2, 50, 61.8, 78.6, 100 persen)
- TAMPILAN NILAI RSI (RSI saat ini di dekat harga)
- Warna yang dapat disesuaikan
- Dioptimalkan untuk performa (maksimum bar untuk digambar)
--------------------------------------------------
DEVASI OTOMATIS - FITUR UTAMA
Dua mode deviasi tersedia:
- PIP TETAP: Tetapkan jarak pip minimum tetap antara ayunan
- BERBASIS ATR (OTOMATIS): Deviasi dinamis berdasarkan volatilitas saat ini
MENGAPA DEVASI OTOMATIS PENTING:
- M1 sampai M5: Deviasi ketat (menangkap ayunan kecil)
- H1 sampai H4: Deviasi sedang (menangkap struktur)
- D1 sampai MN1: Deviasi lebar (menangkap ayunan besar)
Indikator secara otomatis menyesuaikan dengan timeframe yang Anda gunakan. Tidak perlu penyesuaian manual saat mengganti grafik.
Ini membuat Swing Detector dapat digunakan di SEMUA timeframe — dari grafik 1 menit hingga bulanan.
--------------------------------------------------
RETRACEMENT FIBONACCI - FITUR UTAMA
Untuk ayunan terakhir yang selesai, indikator menggambar:
- 0,0 persen (awal ayunan)
- 23,6 persen
- 38,2 persen
- 50,0 persen
- 61,8 persen
- 78,6 persen
- 100,0 persen (akhir ayunan)
Nyalakan/matikan garis dan label. Semua level diberi kode warna untuk referensi visual cepat.
--------------------------------------------------
TAMPILAN RSI - FITUR UTAMA
Nilai RSI saat ini ditampilkan di dekat harga dengan kode warna:
- MERAH: RSI di atas 70 (jenuh beli)
- HIJAU: RSI di bawah 30 (jenuh jual)
- PUTIH: RSI antara 30 dan 70 (netral)
Ini memberikan konteks momentum langsung tanpa membuka jendela RSI terpisah.
--------------------------------------------------
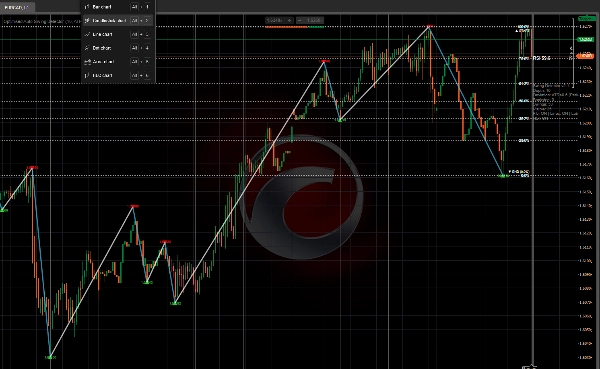
ELEmen VISUAL
- Panah merah ke bawah = Ayunan tinggi
- Panah hijau ke atas = Ayunan rendah
- Garis biru = Ayunan naik (dari rendah ke tinggi)
- Garis oranye = Ayunan turun (dari tinggi ke rendah)
- Garis horizontal emas = Level Fibonacci
- Label putih = Persentase Fibonacci
- Nilai RSI = RSI saat ini di dekat harga
- Panel info = Kedalaman, deviasi, backstep, jumlah ayunan
--------------------------------------------------
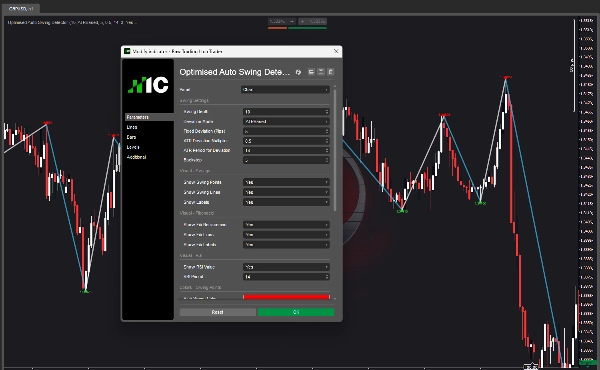
RINGKASAN PARAMETER
PENGATURAN AYUNAN:
- Kedalaman Ayunan: Berapa banyak bar yang diperiksa untuk ekstrem lokal
- Mode Deviasi: Pips Tetap atau Berbasis ATR (Otomatis)
- Deviasi Tetap: Jarak pip minimum antara ayunan
- Pengali Deviasi ATR: Pengali untuk deviasi berbasis ATR
- Periode ATR: Periode untuk perhitungan ATR
- Backstep: Bar minimum antara ayunan
VISUAL - AYUNAN:
- Tampilkan Titik Ayunan: Nyalakan/matikan panah
- Tampilkan Garis Ayunan: Nyalakan/matikan garis tren
- Tampilkan Label: Nyalakan/matikan label harga
VISUAL - FIBONACCI:
- Tampilkan Fib Retracement: Nyalakan/matikan overlay Fibonacci
- Tampilkan Garis Fib: Nyalakan/matikan garis horizontal
- Tampilkan Label Fib: Nyalakan/matikan label persentase
VISUAL - RSI:
- Tampilkan Nilai RSI: Nyalakan/matikan overlay RSI
- Periode RSI: Periode untuk perhitungan RSI
WARNA:
- Warna Ayunan Tinggi
- Warna Ayunan Rendah
- Warna Garis Ayunan Naik
- Warna Garis Ayunan Turun
- Warna Garis Fib
- Warna Teks Fib
- Warna Label RSI
PERFORMA:
- Maksimum Bar untuk Digambar: Membatasi gambar untuk performa lebih cepat
--------------------------------------------------
KASUS PENGGUNAAN
- Identifikasi titik ayunan struktural pada SEMUA timeframe
- Gambar garis tren antara ayunan
- Gunakan level Fibonacci untuk entri, keluar, dan target keuntungan
- Konfirmasi perdagangan dengan konfluensi RSI
- Pahami struktur pasar secara sekilas
- Beralih timeframe tanpa mengubah parameter (Deviasi Otomatis)
--------------------------------------------------
KEGUNAAN TIMEFRAME
Dengan DEVASI OTOMATIS diaktifkan, indikator bekerja di:
- M1, M5, M15 (scalping)
- M30, H1, H4 (day trading)
- D1 (swing trading)
- W1, MN1 (position trading)
Satu indikator. Semua timeframe.
--------------------------------------------------
TINGKATKAN KE ZONA PANAS STRUKTURAL
Indikator gratis ini menunjukkan ayunan dan struktur.
Zona Panas Struktural membawa lebih jauh — memetakan intensitas partisipasi, penerimaan vs penolakan, dan keterlibatan pasar di berbagai zona.
Cari Zona Panas Struktural di cTrader Store.
--------------------------------------------------
TINGKATKAN KE INVICTUS EA
Invictus EA menggunakan teknologi struktural yang sama untuk mengeksekusi perdagangan otomatis.
Cari Invictus di cTrader Store.
--------------------------------------------------
CATATAN TEKNIS
- Indikator overlay
- Bekerja pada semua timeframe dan simbol
- Tidak ada repainting (ayunan bersifat historis)
- Dioptimalkan untuk performa
--------------------------------------------------
DUKUNGAN
Pembaruan seumur hidup termasuk.
UNTUK INFORMASI LEBIH LANJUT - Klik Profil Pengembang di bawah.
Ringkasan
Ulasan pelanggan
5 | 100 % | |
4 | 0 % | |
3 | 0 % | |
2 | 0 % | |
1 | 0 % |


![Logo "[Stellar Strategies] Inside Bar with Signals"](https://cdn.ctrader.com/image/webp/1d9e8bfa-3b2c-4440-bb37-5856902008a7_30683)


