Описание
🚀 Более 10 000 трейдеров уже используют наши ЛУЧШИЕ индикаторы🏆
👉 Получите все наши ЛУЧШИЕ системы здесь:
_______________________________________________
📌 Индикаторы структуры рынка
· ✅ AdvancedMarket Structure: Bos, Choch, SwinLevels, Order Blocks, Market Structure& Liquidity Finder
· 🔄 Dynamic Market StructureAnalysis of Turning Points
· 🧱 Order Block
· ⚖️ Market Imbalance
· ⛓️ BOS & CHOCH
· 🧠 ICT Power of 3
_______________________________________________
🔚 Системы умного выхода
_______________________________________________
📐 Индикаторы ZigZag
· 🔍 ZigZag Price LiquidityProjection
· ➖ ZigZag
_______________________________________________
🧱 Индикаторы поддержки и сопротивления
· 🟩 SmartTrend Support &Resistance Lines
· 🧱 All Support and ResistanceLevels
_______________________________________________
📊 Индикаторы тренда и каналов
· 📊 Supertrend
_______________________________________________
💧 Инструменты объема и ликвидности
_______________________________________________
⚡ Индикаторы импульса и RSI
· 🔎 Multi-Level Candle Bias
Tracker
_______________________________________________
🔮 Инструменты прогнозирования и проекции
· 📐 Прогноз на основе Linreg& ATR
· 📏 Фибоначчи линейная регрессияМультивременной интервал
· 📈 Проектор рыночного потока на основе объема
________________________________________________________________________________________
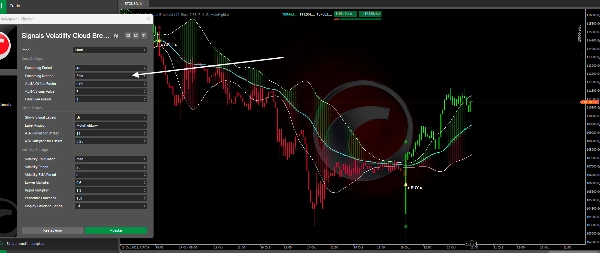
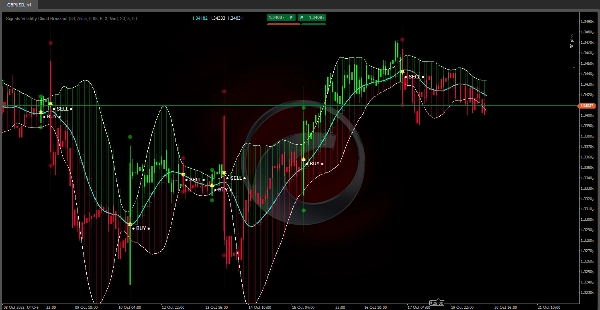
СИГНАЛЫ ПРОРЫВА ОБЛАКА ВОЛАТИЛЬНОСТИ.
Общий обзор 💡
Adaptive Trend Bands — это продвинутый индикатор следования за трендом, который сочетает адаптивную фильтрацию цены с динамическими полосами волатильности. В отличие от традиционных статичных индикаторов полос, эта система автоматически регулирует свою чувствительность в зависимости от меняющихся рыночных условий, обеспечивая более точные сигналы в различных условиях волатильности. 🎯
Что делает этот индикатор? 🤔
Индикатор генерирует отфильтрованное и сглаженное представление цены (OHLC), которое устраняет рыночный шум, позволяя с большей ясностью визуализировать базовый тренд. Одновременно он рассчитывает верхние и нижние полосы, которые автоматически расширяются или сужаются в зависимости от текущей волатильности, адаптируясь к спокойным или турбулентным рынкам. 🌊
Ключевые особенности: ✨
- Адаптивная фильтрация цены с использованием алгоритмов ALMA или EMA
- Полосы волатильности, которые динамически регулируются с использованием исторических процентилей
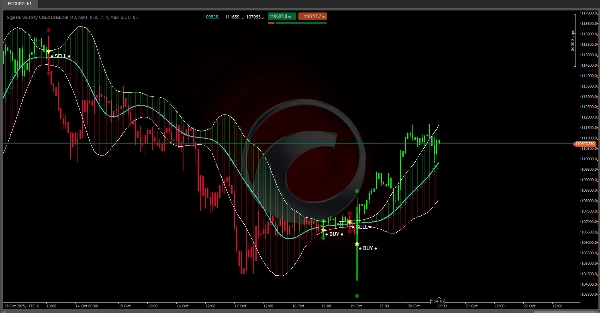
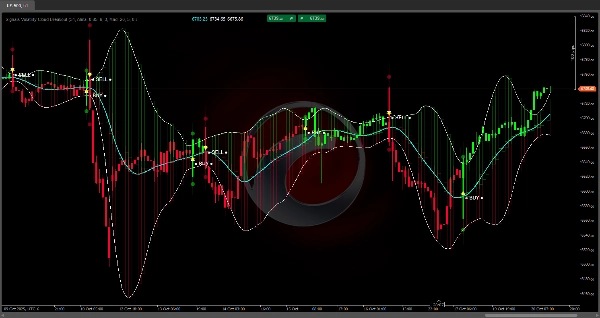
- Визуальные сигналы ПОКУПКИ/ПРОДАЖИ при пересечении цены с полосами 🟢🔴
- Окраска свечей в зависимости от обнаруженного тренда (зеленый — бычий / красный — медвежий)
- Цветные облака между отфильтрованными линиями для визуализации силы тренда 💪
Как это работает? ⚙️
Система фильтрации
Индикатор применяет двухэтапный процесс сглаживания цены:
- Первый слой: Использует ALMA (скользящая средняя Арно Легу) или традиционные фильтры EMA для устранения краткосрочных колебаний. ALMA особенно эффективна, так как снижает запаздывание при сохранении плавности.
- Второй слой: Применяет дополнительное сглаживание EMA к результату первого фильтра, создавая ультра-плавную линию тренда, которая сбалансированно реагирует на изменения цены.
Адаптивный расчет волатильности 📏
Система измеряет рыночную волатильность двумя методами:
- Стандартное отклонение (StdDev): классический метод измерения дисперсии
- Среднее абсолютное отклонение (MAD): более устойчивое к экстремальным значениям
Рассчитанная волатильность сглаживается и затем сравнивается с историей прошлых волатильностей для определения её процентильного ранга. Этот процентиль управляет множителем полос:
- Низкая волатильность (низкий процентиль): полосы ближе к цене 🤏
- Высокая волатильность (высокий процентиль): полосы шире, давая пространство для движения 🌐
Генерация сигналов 🔔
Сигналы активируются, когда фактическая цена пересекает адаптивные полосы:
- После активации сигнала индикатор сохраняет статус тренда до противоположного пересечения, предотвращая преждевременные сигналы в зонах консолидации. 🛡️
Для чего это используется? 🛠️
Идентификация тренда 👀
Индикатор окрашивает свечи в соответствии с направлением обнаруженного тренда, позволяя быстро определить, находится ли рынок в бычьей или медвежьей фазе. Цветные облака между отфильтрованными линиями визуально усиливают восприятие силы и направления движения.
Точки входа и выхода ➡️🚪
Сигналы ПОКУПКИ/ПРОДАЖИ, отмеченные заметными иконками, указывают на потенциальные моменты для входа или выхода с рынка. Эти сигналы стремятся зафиксировать начало трендов, когда цена демонстрирует достаточный импульс для преодоления адаптивных полос.
Управление позицией 💼
Верхние и нижние полосы служат уровнями ориентира для:
- Определения динамических стопов
- Выявления относительных зон перекупленности/перепроданности 🏷️
- Оценки ослабления тренда (откат цены к центральной линии) 📉
Сводка
Key features include visual BUY/SELL signals triggered when price crosses the adaptive bands, candle coloring to indicate bullish or bearish trends, and colored clouds between filtered lines to represent trend strength. The bands also serve as dynamic reference levels for setting stops, identifying overbought or oversold conditions, and assessing trend strength. This indicator supports various markets including Forex, Crypto, Stocks, and symbols such as BTCUSD, EURUSD, GBPUSD, XAUUSD, and USDJPY. It is intended for trend identification, entry and exit timing, and position management within diverse trading environments.