
Deskripsi
Rigid Volume Profile membagi jendela tinjauan Anda menjadi sejumlah tingkat harga tetap dan menunjukkan berapa banyak volume yang diperdagangkan di masing-masing, dibagi menjadi tekanan beli dan jual.
APA YANG DIGAMBAR
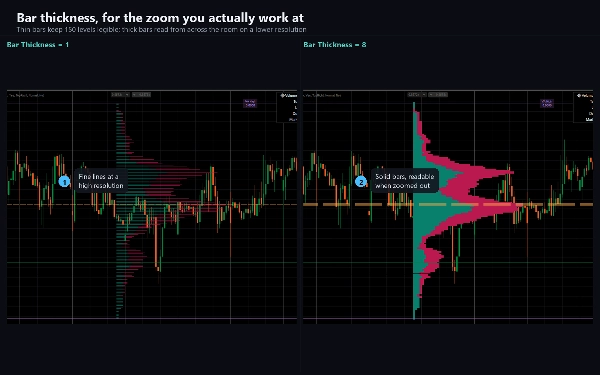
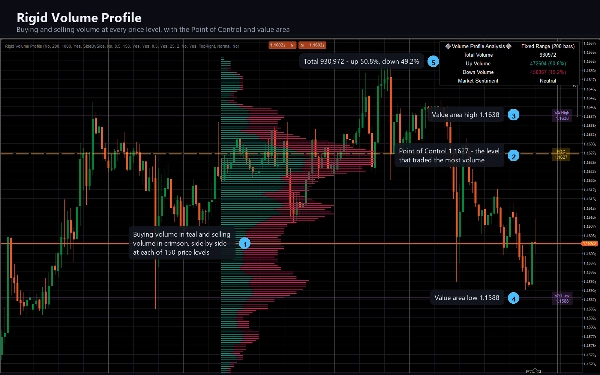
Histogram horizontal di samping aksi harga, dibangun dari N bar terakhir. Bar setiap tingkat dibagi menjadi volume bullish (dari bar yang ditutup naik) dan volume bearish (dari bar yang ditutup turun), sehingga Anda dapat melihat tidak hanya di mana perdagangan terjadi tetapi sisi mana yang melakukannya. Bar yang ditutup tanpa perubahan membagi volumenya secara merata antara keduanya.
Garis Point of Control putus-putus menandai tingkat harga yang memperdagangkan volume terbanyak dalam jendela, diberi label dengan harga tepatnya.
Dua garis area nilai membatasi tingkat yang mencakup 70% dari volume jendela, masing-masing diberi label.
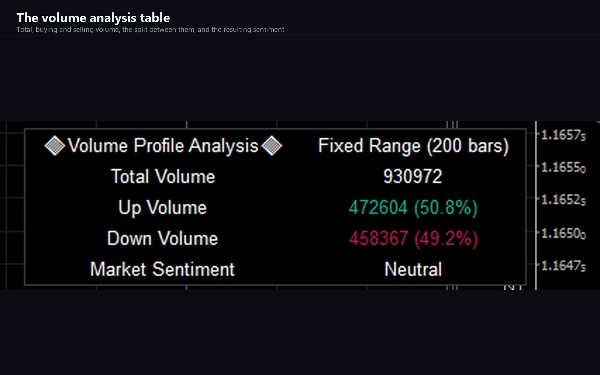
Tabel analisis volume melaporkan total, volume naik dan turun dengan persentase, serta pembacaan sentimen berdasarkan sisi mana yang mendominasi.
CARA MENGGUNAKANNYA
Profil volume menggambarkan di mana perdagangan benar-benar terjadi, bukan hanya di mana harga bergerak. Tingkat yang menyerap banyak volume adalah tingkat yang diperhatikan banyak peserta; bagian tipis dari profil adalah rentang harga yang dilalui pasar dengan cepat.
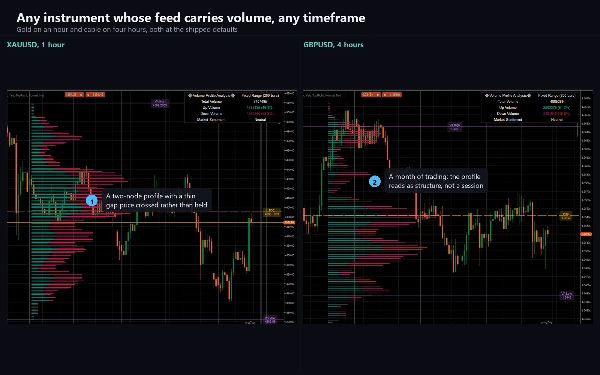
Bacalah Point of Control sebagai pusat gravitasi jendela. Bacalah area nilai sebagai rentang di mana sebagian besar bisnis dilakukan. Bacalah celah tipis antara dua node berat sebagai zona yang cenderung dilalui harga daripada bertahan di dalamnya. Perhatikan sisi mana dari pembagian yang mendominasi tingkat saat harga kembali ke sana.
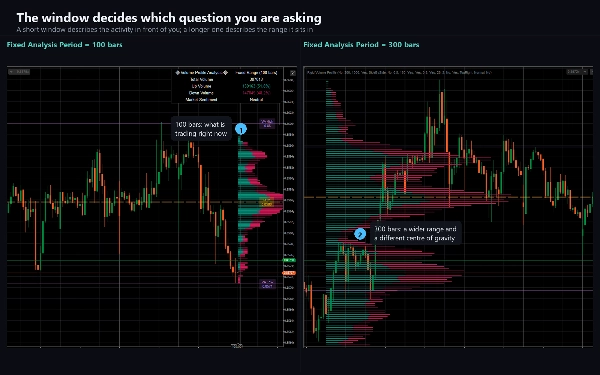
Jendela adalah pilihan Anda dan gambarnya berubah bersamanya, jadi pilih tinjauan yang sesuai dengan keputusan yang Anda buat. Profil 100 bar menjawab pertanyaan yang berbeda dari profil 500 bar.
PENGATURAN UTAMA
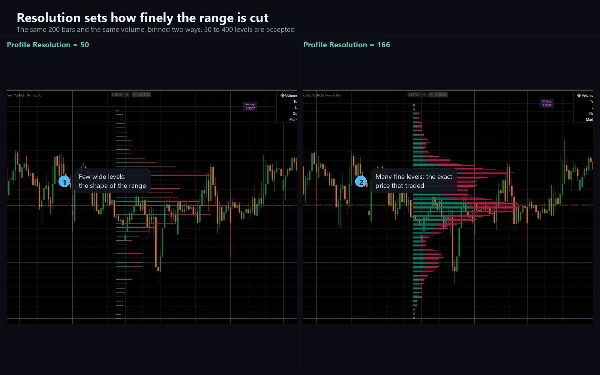
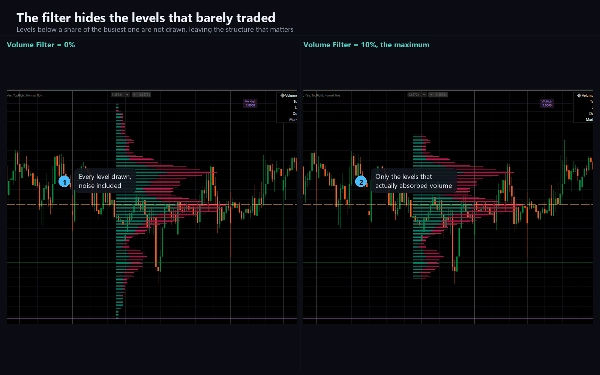
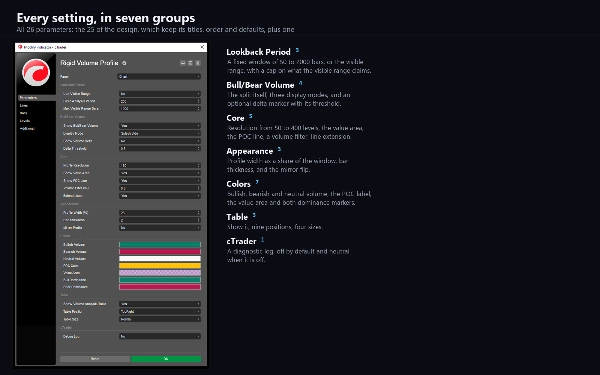
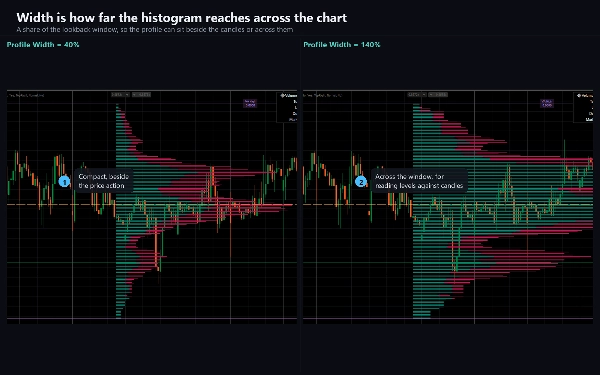
Fixed Analysis Period mengatur tinjauan dalam bar, 50 hingga 2000. Profile Resolution mengatur berapa banyak tingkat harga yang dibagi dalam rentang, 50 hingga 400; tingkat yang lebih sedikit dibaca seperti profil klasik, lebih banyak memberikan detail halus. Display Mode menawarkan Side by Side, Stacked, dan Split. Profile Width mengukur histogram sebagai persentase dari tinjauan. Volume Filter menyembunyikan tingkat di bawah persentase dari yang tersibuk. Show Volume Delta menambahkan penanda di mana satu sisi jelas mendominasi. Setiap warna dapat disesuaikan, dan tabel analisis dapat dipindahkan ke sembilan posisi atau dimatikan.
Use Visible Range mengalihkan tinjauan ke bar yang saat ini ada di layar daripada hitungan tetap.
JENIS INDIKATOR DAN JENDELA
Overlay grafik. Ini digambar pada grafik harga itu sendiri, bukan di panel terpisah.
TIMEFRAME DAN INSTRUMEN
Timeframe apa pun. Ini paling berguna intraday, dari M5 hingga H4, di mana distribusi volume sesi adalah objek yang bermakna.
Bekerja pada instrumen apa pun yang feed-nya membawa volume. Pada forex itu adalah volume tick, jumlah pembaruan harga per bar, yang merupakan proksi untuk aktivitas daripada ukuran yang diperdagangkan. Pada CFD indeks dan komoditas beberapa broker menyediakan volume bursa nyata, dan profil lebih bermakna di sana. Pada instrumen tanpa volume sama sekali, tidak ada yang digambar.
UNTUK SIAPA
Trader yang sudah bekerja dengan profil volume dan menginginkan satu dengan grid tetap yang dapat disesuaikan dan pembagian beli dan jual yang eksplisit, bukan profil sesi tetap.
UJI COBA
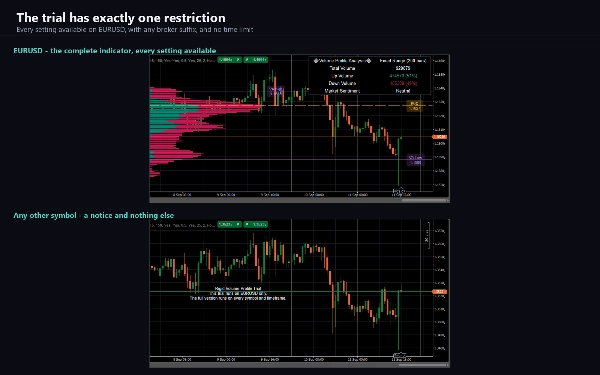
Edisi uji coba disertakan dengan produk ini. Ini adalah indikator lengkap dengan semua pengaturan tersedia, dibatasi pada EURUSD. Versi penuh menghapus batasan itu dan tidak menambahkan apa pun lagi.
CATATAN TEKNIS DAN BATASAN
Profil dihitung ulang pada setiap tick bar yang sedang terbentuk, sehingga Point of Control dan area nilai bergerak dalam satu bar dan menetap saat bar ditutup. Ini memang disengaja. Tidak ada yang di sini merupakan sinyal bar tertutup.
Pada Profile Resolution di atas 166, tingkat harga terendah tidak digambar. Ini adalah batasan desain yang disengaja, yang menyisihkan kumpulan objek gambar tetap dan menggunakan tiga per tingkat harga; toggle Show POC Line dan Show Value Area masing-masing membebaskan satu. Pertahankan Profile Resolution pada 166 atau di bawahnya untuk melihat profil lengkap.
Area nilai dibangun dengan mengurutkan tingkat berdasarkan volume dan mengambilnya dalam urutan itu sampai mencapai 70%, kemudian melaporkan harga tertinggi dan terendah di antaranya. Oleh karena itu biasanya lebih lebar daripada area nilai yang dibangun dengan berjalan keluar dari Point of Control.
Karena profil dibangun dari volume broker Anda, dua broker tidak akan menghasilkan profil identik dari pasar yang sama.
AccessRights adalah None: indikator tidak menempatkan pesanan, tidak memodifikasi apa pun, dan tidak membaca data akun.
DUKUNGAN
Dokumentasi yang mencakup setiap parameter, pengaturan yang mengejutkan orang, dan panduan pemecahan masalah disertakan dengan produk. Pertanyaan dipersilakan melalui tab Diskusi; laporan yang berguna mencantumkan simbol, broker, timeframe, versi cTrader, dan pengaturan yang diubah dari default.
Perdagangan melibatkan risiko. Kinerja masa lalu tidak menjamin hasil di masa depan.
Ringkasan
Users can customize the lookback period (50 to 2000 bars), profile resolution (50 to 400 levels), display mode (side by side, stacked, split), profile width, and volume filtering. The profile updates dynamically on every tick of the forming bar. It supports any timeframe and instruments with volume data, including tick volume for forex and real exchange volume for some CFDs. The indicator is intended for traders familiar with volume profiles seeking detailed buying and selling pressure insights on a fixed grid rather than session-based profiles. A trial version is available with full features restricted to EURUSD.
















![Logo "High-Low Divergence [Iridio Capital]"](https://cdn.ctrader.com/image/webp/10a9e91b-243a-43f6-bbfe-7376bad5a214_61554)