
Descrizione
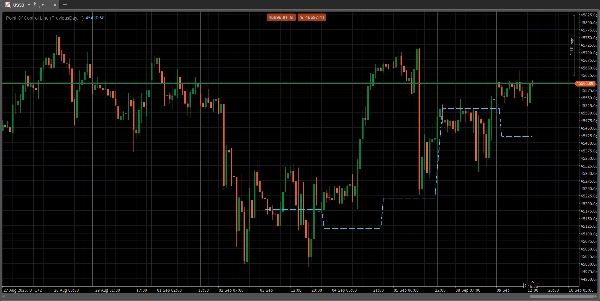
Il Punto di Controllo (POC) è un livello di prezzo su un grafico del profilo di volume dove è stato effettuato il maggior volume di scambi in un periodo specificato. Questo livello agisce come una zona significativa di supporto o resistenza perché rappresenta un prezzo in cui le grandi istituzioni di trading sono state più attive e dove il prezzo di mercato ha trovato consenso. I trader utilizzano il POC per identificare zone chiave di prezzo, valutare il sentiment del mercato e anticipare potenziali movimenti e inversioni di prezzo.
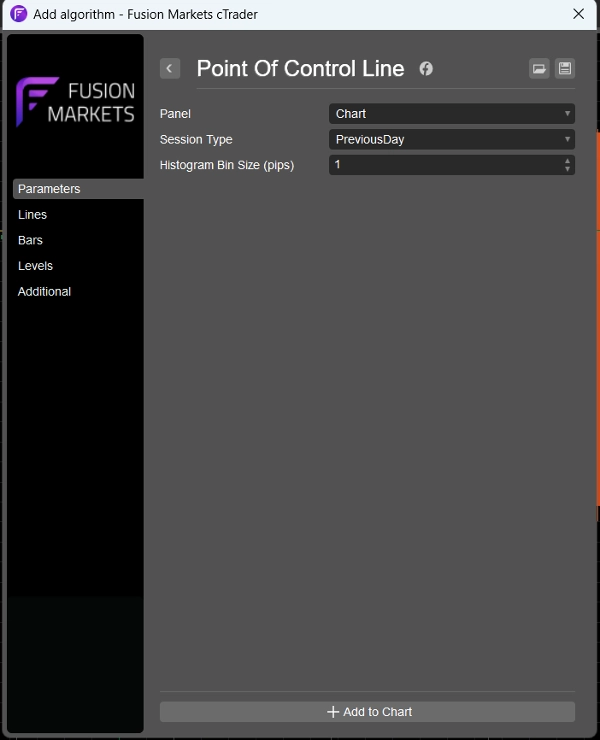
Ho rimosso tutto il rumore dagli indicatori usuali del profilo di volume lasciando solo la linea POC per coloro che richiedono solo la linea. Ho incluso un parametro per visualizzare la linea POC per il giorno precedente, il profilo di volume a 4 ore o a 1 ora, quindi è adatto per trader di diversi intervalli temporali.
Riepilogo
Recensioni dei clienti
5 | 100 % | |
4 | 0 % | |
3 | 0 % | |
2 | 0 % | |
1 | 0 % |


