Descrizione
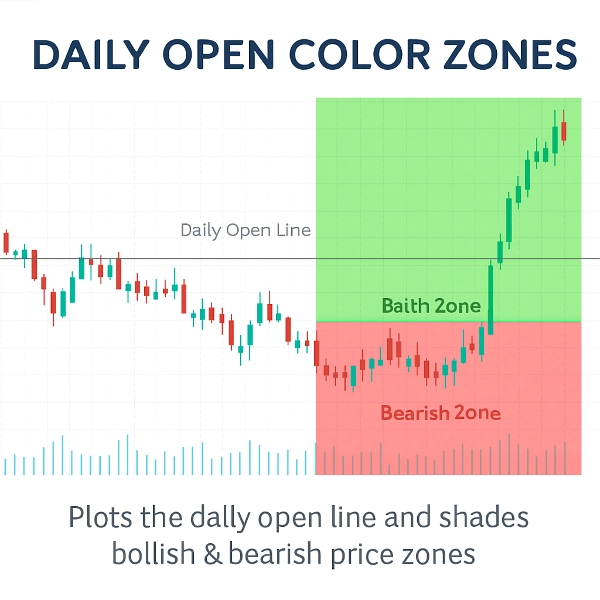
Questo indicatore è uno strumento professionale progettato per tracciare la Linea di Apertura Giornaliera e ombreggiare istantaneamente le zone di prezzo rialziste e ribassiste intorno ad essa. Invece di lasciare i trader a indovinare, fornisce una mappa visiva chiara del sentimento del mercato fin dal primo momento della giornata. Il suo obiettivo: aiutarti a identificare immediatamente se il mercato sta trattando sopra o sotto l'apertura giornaliera — un punto di riferimento chiave per le strategie intraday.
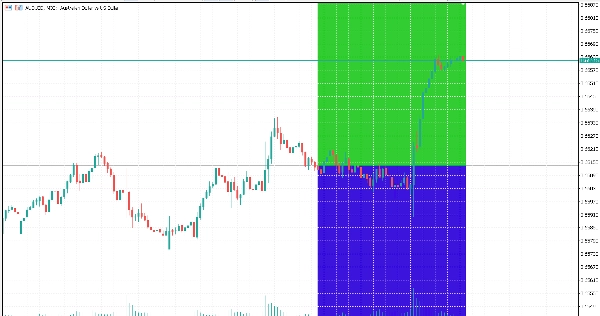
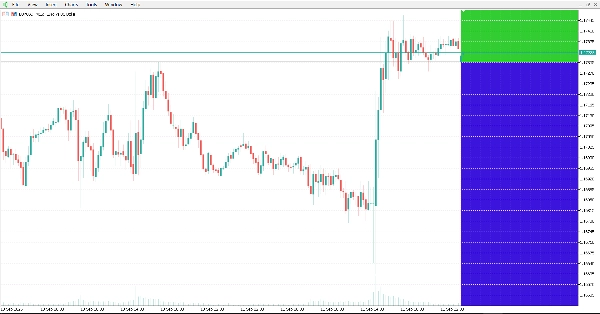
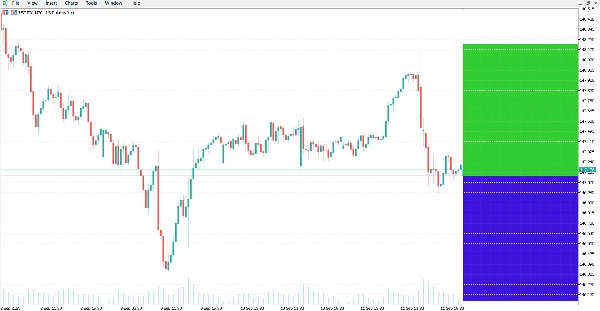
L'indicatore traccia automaticamente una linea orizzontale al prezzo di apertura giornaliera e ombreggia il grafico:
Zona Verde sopra la linea per il territorio rialzista.
Zona Rossa sotto la linea per il territorio ribassista.
Questo semplice ma potente segnale visivo aiuta i trader a valutare rapidamente il bias, individuare potenziali inversioni e allineare le operazioni con la direzione prevalente del mercato.
Caratteristiche
Linea di Apertura Giornaliera Automatica: Traccia con precisione il prezzo esatto di apertura giornaliera.
Zone di Colore Chiare: Distingui istantaneamente le aree rialziste e ribassiste con colori e trasparenze personalizzabili.
Aggiornamenti Dinamici: Le zone si adattano automaticamente a ogni nuova candela e zoom del grafico.
Aspetto Personalizzabile: Cambia lo stile della linea, lo spessore e i colori delle zone per adattarli al tema del tuo grafico.
Leggero e Veloce: Ottimizzato per un uso minimo della CPU, anche su conti live con grandi dataset.
Funziona su Tutti i Simboli e Timeframe: Dal forex alle materie prime, indici e criptovalute.
Perché Usarlo? L'apertura giornaliera è uno dei livelli di prezzo più osservati dai trader professionisti. Separando visivamente le zone rialziste e ribassiste, questo indicatore ti offre una lettura immediata del sentimento del mercato, aiutandoti a prendere decisioni di trading più rapide e sicure.
Conclusione Questo non è solo una linea sul tuo grafico — è un vantaggio visivo nel trading. Che tu faccia scalp, day trading o swing trading, l'indicatore Daily Open Color Zones ti manterrà ancorato a uno dei livelli di prezzo più importanti della giornata.


![Logo di "[Stellar Strategies] Smart ADX"](https://cdn.ctrader.com/image/webp/af13b084-b6f6-41db-b7bc-c7e688b57b05_36929)


