
Descrizione
Dynamic Trend Flux
Tipo: Oscillatore di momentum / trend (stile MACD, multicolore)
Cosa fa
Dynamic Trend Flux è un oscillatore di momentum colorato basato sulla classica differenza tra EMA veloce/lenta più una linea di segnale.
Ti aiuta a vedere a colpo d'occhio:
- quando il momentum è rialzista o ribassista,
- se il momentum è in crescita o in diminuzione,
- e dove si verificano cambiamenti di trend (incroci tra linea principale e linea di segnale).
L'indicatore disegna:
- Linea principale (linea Flux)
-
- costruita dalla differenza tra una EMA veloce e una lenta
- cambia colore a seconda che sia sopra o sotto la linea di segnale (opzionale).
- Linea di segnale
-
- una media mobile della linea principale, usata come attivatore più smussato.
- Istogramma con 4 colori (opzionale)
-
- mostra la distanza tra linea principale e linea di segnale,
- il colore codifica sia la direzione (sopra/sotto zero) sia il cambiamento di forza da barra a barra.
- Punti sugli incroci (opzionale)
-
- evidenzia dove la linea principale incrocia la linea di segnale → potenziali cambiamenti di fase del trend.
Tutti i calcoli sono effettuati sul timeframe corrente del grafico.
Come leggerlo
1. Linea zero
- Valori sopra lo zero → domina la pressione rialzista.
- Valori sotto lo zero → domina la pressione ribassista.
2. Istogramma colorato
Con modalità a 4 colori ATTIVATA:
- Azzurro → sopra lo zero e in aumento
-
- momentum rialzista forte / in crescita.
- Blu → sopra lo zero ma in calo
-
- trend rialzista ancora presente, ma momentum in raffreddamento.
- Rosso → sotto lo zero e in calo
-
- momentum ribassista forte / in crescita.
- Marrone scuro → sotto lo zero ma in aumento
-
- fase ribassista ancora presente, ma momentum in perdita di forza.
Questo rende molto più facile individuare visivamente divergenze e cambi di momentum.
3. Linee principale e di segnale
- Linea principale sopra Segnale → fase rialzista.
- Linea principale sotto Segnale → fase ribassista.
Se il cambio colore è abilitato:
- Linea principale Lime = sopra Segnale (controllo rialzista)
- Linea principale Rosso = sotto Segnale (controllo ribassista)
4. Punti sugli incroci
- Punto verde (Incrocio verso l'alto) → la linea principale incrocia sopra la linea di segnale
-
- possibile inizio di un rimbalzo rialzista.
- Punto rosso (Incrocio verso il basso) → la linea principale incrocia sotto la linea di segnale
-
- possibile inizio di un rimbalzo ribassista.
Combina sempre questi segnali con la struttura / azione del prezzo e il contesto di timeframe superiore.
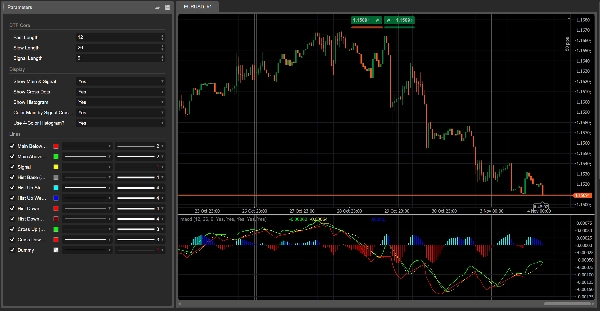
Parametri (Inglese)
DTF Core
- Fast Length – periodo della EMA veloce (default 12).
- Slow Length – periodo della EMA lenta (default 26).
- Signal Length – periodo della SMA di segnale applicata alla linea principale (default 9).
Visualizzazione
- Mostra Linea Principale & Segnale – attiva/disattiva le due linee.
- Mostra Punti Incrocio – mostra i punti sugli incroci principale/segno.
- Mostra Istogramma – attiva/disattiva l'istogramma sullo sfondo.
- Colora Linea Principale in base all'Incrocio con Segnale?
-
- ON → linea principale Lime sopra segnale, Rosso sotto.
- OFF → linea principale rimane Rossa.
- Usa Istogramma a 4 Colori?
-
- ON → logica aqua / blu / rosso / marrone scuro.
- OFF → istogramma di un unico colore grigio.
Riepilogo
Recensioni dei clienti
5 | 0 % | |
4 | 100 % | |
3 | 0 % | |
2 | 0 % | |
1 | 0 % |


