Descrizione
📈 Indicatore Skew Volatility Bias – Versione Professionale (per cTrader)
Sblocca una comprensione più profonda della pressione di mercato, dello squilibrio di volatilità e della convinzione direzionale con il Indicatore Skew Volatility Bias, la versione migliorata di un approccio classico basato sulla volatilità originariamente ispirato da Pine Script e ora completamente ottimizzato per cTrader.
Questo strumento aiuta i trader a visualizzare quale lato del mercato colpisce più forte — acquirenti o venditori — misurando l'asimmetria della volatilità e convertendola in un segnale chiaro e facile da leggere.
Che tu stia negoziando indici, forex, materie prime o criptovalute, questo indicatore funge da potente filtro di tendenza, rilevatore di regime e strumento di conferma del bias.
1. Cosa misura l'Indicatore Skew
L'indicatore valuta il bilanciamento della volatilità tra candele rialziste e ribassiste.
Calcola un True Range normalizzato e lo inserisce in due medie adattive:
- Deviazione Max → volatilità prodotta durante le candele rialziste
- Deviazione Min → volatilità prodotta durante le candele ribassiste
Poi calcola:
👉 Skew = DeviazioneMax / DeviazioneMin
Questo converte la volatilità grezza in una lettura direzionale chiara:
- Skew > 1 → i movimenti al rialzo sono mediamente più forti
- Skew < 1 → i movimenti al ribasso sono più forti
- Skew ≈ 1 → la volatilità è simmetrica e il mercato è bilanciato
In breve:
Skew rivela quale lato ha la “dominanza della volatilità”.
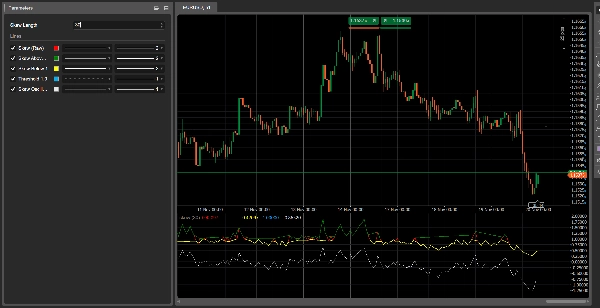
2. Comprendere le Linee
1. Skew (Grezza) – Linea rossa
Il rapporto puro di volatilità. Questo è il segnale principale.
2. Skew Sopra 1 – Linea verde
Mostra la dominanza della volatilità rialzista.
3. Skew Sotto 1 – Linea gialla
Mostra la dominanza della volatilità ribassista.
4. Linea di Soglia 1.0 – Linea tratteggiata blu
Rappresenta l'equilibrio.
5. Oscillatore Skew (log) – Linea bianca
Rappresentazione più stabile e più fluida:
- sopra 0 = volatilità rialzista
- sotto 0 = volatilità ribassista
3. Come Leggerlo
A) Regimi di Mercato
🔹 Regime Rialzista
- Skew > 1
- Linea verde attiva
- Oscillatore sopra zero
→ Il mercato favorisce posizioni long.
🔹 Regime Ribassista
- Skew < 1
- Linea gialla attiva
- Oscillatore sotto zero
→ Il mercato favorisce posizioni short.
🔹 Neutro
- Skew ≈ 1
→ Mercato bilanciato, adatto al trading in range.
4. Segnali di Cambio di Regime
Skew che supera 1 verso l'alto
→ Gli acquirenti acquisiscono la dominanza della volatilità
→ Transizione rialzista
Skew che scende sotto 1
→ I venditori acquisiscono la dominanza della volatilità
→ Transizione ribassista
Questi cambiamenti spesso avvengono prima che l'azione del prezzo confermi una tendenza, rendendo Skew un potente indicatore anticipatore.
5. Casi d'Uso Pratici
1️⃣ Filtro di Tendenza per cBots
- negoziare long solo quando SkewOsc > 0
- negoziare short solo quando SkewOsc < 0
2️⃣ Conferma della Qualità della Tendenza
- Tendenza rialzista + Skew > 1 = tendenza forte
- Tendenza rialzista + Skew che scende verso 1 = tendenza che si indebolisce
3️⃣ Sentimento di Mercato / Filtro di Rischio
Particolarmente efficace su indici e coppie FX principali.
6. Riepilogo
- Cosa mostra: dominanza della volatilità
- Perché è importante: i cambiamenti di volatilità precedono i cambiamenti di prezzo
- Come usarlo: come filtro, strumento di conferma o indicatore di sentimento
- La parte migliore: estremamente leggero, veloce e adattabile
Riepilogo
Recensioni dei clienti
5 | 67 % | |
4 | 33 % | |
3 | 0 % | |
2 | 0 % | |
1 | 0 % |


