
Descrizione
SmartTrendScanner
Panoramica
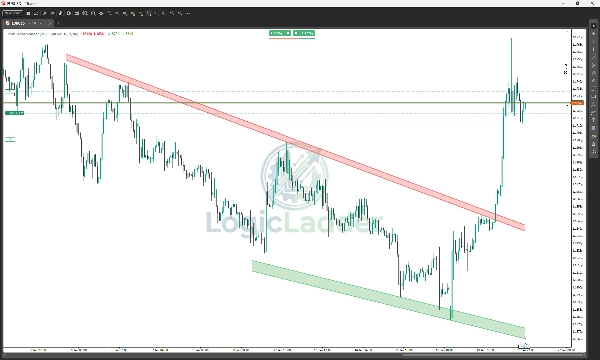
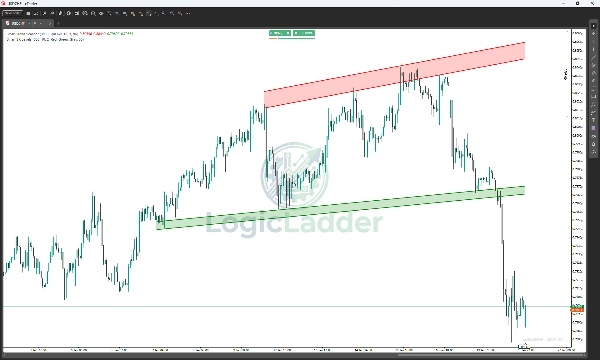
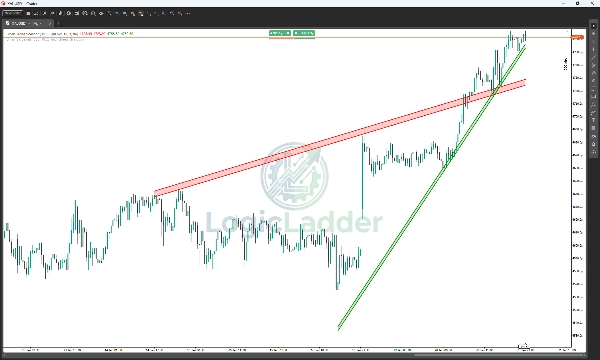
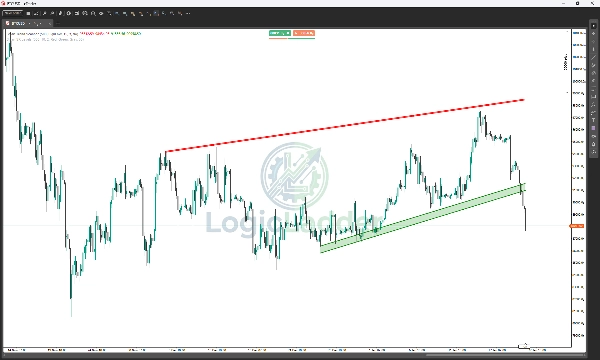
SmartTrendScanner è un indicatore professionale per cTrader progettato per automatizzare l'arte soggettiva dell'analisi delle tendenze. A differenza degli indicatori tradizionali che tracciano linee di tendenza sottili a prezzo singolo, SmartTrendScanner identifica e visualizza dinamiche Zone Cloud di Domanda e Offerta.
Alimentato da un algoritmo "Best-Fit", analizza l'azione storica del prezzo per trovare i punti di connessione matematicamente più significativi, tracciando canali pieni che rappresentano l'area vera di supporto e resistenza.
Caratteristiche principali
- Zone Cloud Dinamiche: Sostituisce le linee sottili con canali "cloud" pieni, coprendo visivamente l'intera gamma di tocchi di prezzo (ombre e corpi) per prevenire falsi segnali.
- Rilevamento Intelligente dei Pivot: Identifica automaticamente i principali Swing High e Swing Low basati sulle tue impostazioni di sensibilità personalizzate.
- Algoritmo Best-Fit: L'indicatore crea migliaia di potenziali linee di tendenza in background e le filtra per mostrare solo le zone più forti e rispettate più vicine al prezzo attuale.
- Filtri di Stabilità: Logica integrata che verifica strutture rotte, assicurandoti di non operare su livelli non validi o obsoleti.
- Avvisi in Tempo Reale: Non perdere mai un movimento. Ricevi notifiche popup e sonore istantanee quando il prezzo rompe una zona o ritesta un livello.
- Completamente Personalizzabile: Regola la trasparenza del cloud, i colori, la forza del pivot e la storia del lookback per adattarti al tuo stile di trading (Scalping, Day Trading o Swing).
Come Funziona
- Analizza la Storia: L'indicatore guarda indietro un numero definito dall'utente di barre (ad esempio, 300 barre) per trovare punti pivot frattali.
- Collega i Punti: Testa le connessioni tra i pivot per trovare pendenze di tendenza valide.
- Valida la Zona: Verifica se il prezzo ha "toccato" la linea proiettata abbastanza volte (Min Touches) senza romperla significativamente nel passato recente.
- Disegna il Cloud: Una volta trovata una tendenza valida, disegna un cloud trasparente tra il tocco più alto dell'ombra e il tocco più basso del corpo, creando una "Zona di Azione".
Guida alle Impostazioni
- Barre da Applicare: Quanto indietro nella storia guarda lo scanner (Predefinito: 300). Aumenta questo valore per il trading swing a lungo termine.
- Forza del Pivot: La sensibilità del rilevamento frattale. Numeri più alti (ad esempio, 15+) trovano punti strutturali principali; numeri più bassi (ad esempio, 5) trovano strutture interne minori.
- Conferma Minima del Pivot: Il numero minimo di volte che il prezzo deve toccare la zona perché sia considerata valida.
- Trasparenza della Zona: Controlla l'opacità del colore di riempimento (0 = Invisibile, 255 = Solido).
Perché LogicLadder?
Il trading riguarda la probabilità, non la certezza. Visualizzando Supporto e Resistenza come zone piuttosto che linee sottili, SmartTrendScanner ti aiuta a vedere dove si nasconde la vera liquidità, mantenendoti un passo avanti rispetto alla folla.
Riepilogo
Key features include dynamic cloud zones that cover the full price range to reduce false signals, intelligent pivot detection adjustable by sensitivity, stability filters to avoid outdated levels, and real-time alerts for breakouts or retests. Users can customize settings such as lookback period, pivot strength, minimum touches for zone validation, and cloud transparency to suit various trading styles including scalping, day trading, and swing trading.
Smart Trend Scanner supports multiple markets including Forex, commodities, stocks, and cryptocurrencies, with symbol tags like BTCUSD, EURUSD, GBPUSD, XAUUSD, and NAS100. It aims to provide clearer visualization of liquidity zones to assist traders in making informed decisions based on probabilistic support and resistance areas.


![Logo di "[Stellar Strategies] BOS Trend 1.0"](https://cdn.ctrader.com/image/webp/6cdec0f1-0e97-4a82-a8a4-2b67aed54d38_25695)


