
Descripción
Indicador Tiempo para Alcanzar el Punto de Equilibrio v2
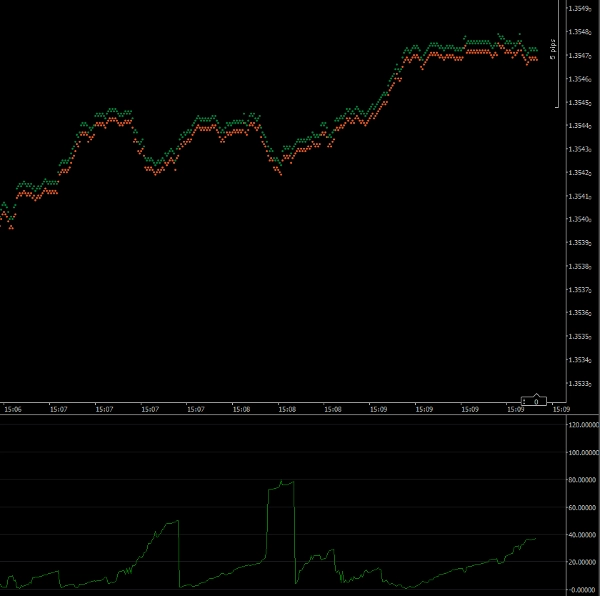
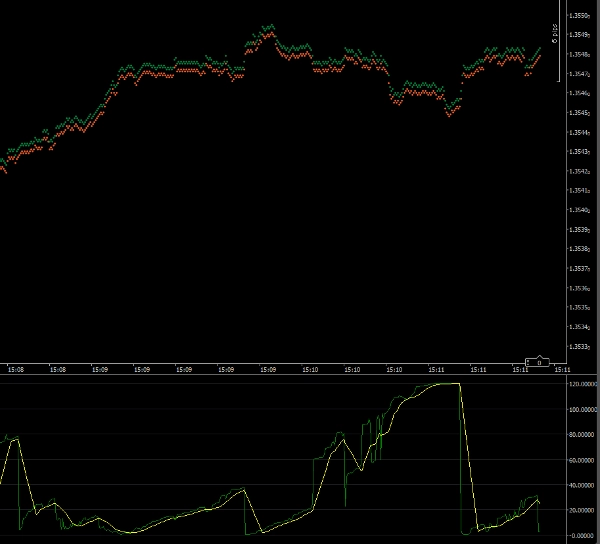
Este indicador te ayudará a cronometrar la entrada de tu operación en el mercado. El gráfico te muestra el probable número de segundos para que tu operación alcance el punto de equilibrio. Si el mercado se mueve rápido y en tu dirección, el indicador mostrará un número pequeño. Si el mercado se mueve en tu contra o lentamente, el número será mayor.
El indicador calcula el número de pips que tu operación requiere para alcanzar el punto de equilibrio. Luego compara esto con la velocidad actual a la que se mueve el precio.
N.B. Este indicador debe ejecutarse en el marco temporal de 1 Tick.
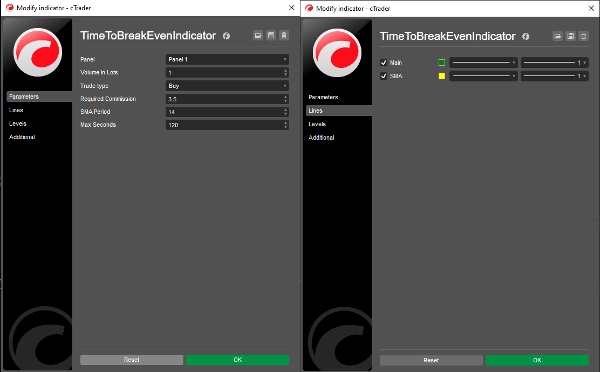
Parámetros
Volumen en Lotes: El volumen de tu operación propuesta
Tipo de Operación: Si tu operación será de compra o venta
Comisión Requerida: La comisión que incurrirá tu operación (puedes obtenerla en la ventana de Operación Rápida)
Periodo SMA: El periodo del gráfico de la Media Móvil Simple (por defecto = 14)
Segundos Máximos: El número máximo de segundos que se registrarán (ver abajo)
Líneas
Principal: La línea del gráfico del indicador (por defecto = verde)
SMA: La línea del gráfico de la Media Móvil Simple (por defecto = amarillo)
Segundos Máximos
Permitir que el indicador muestre valores muy grandes significa que la escala del indicador te impedirá ver el detalle cuando el tiempo para alcanzar el punto de equilibrio sea pequeño. Establecer este parámetro te permite fijar la escala máxima del indicador. Por defecto está configurado en 120 (2 minutos). Así que cualquier resultado de 2 minutos o más se mostrará como 120 segundos.
Dr. Andy Larkin
Copyright 2025, Todos los Derechos Reservados
26 de mayo de 2025
Legal
Los resultados de este indicador deben verificarse para asegurar su precisión antes de usarlos en operaciones en vivo.
No se ofrece ni se implica ninguna garantía sobre los resultados de este indicador.
No se acepta responsabilidad por pérdidas incurridas como resultado del uso de este indicador.
Resumen
Valoraciones de clientes
5 | 50 % | |
4 | 50 % | |
3 | 0 % | |
2 | 0 % | |
1 | 0 % |


