
ORB Range with FVGs
مؤشر
606 التنزيلات
الإصدار 1.0، Sep 2025
Windows, Mac
1.0
التقييمات: 1
الوصف
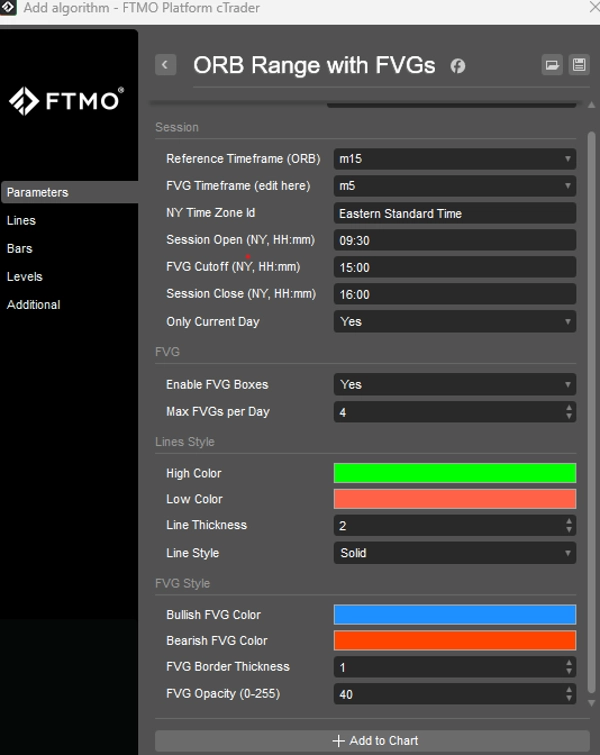
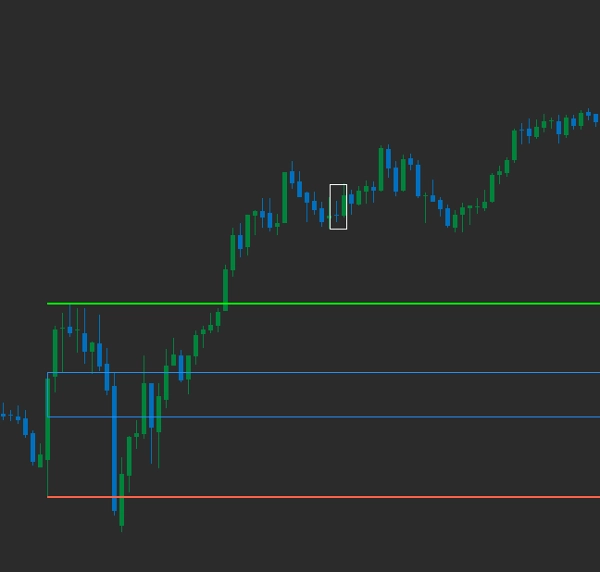
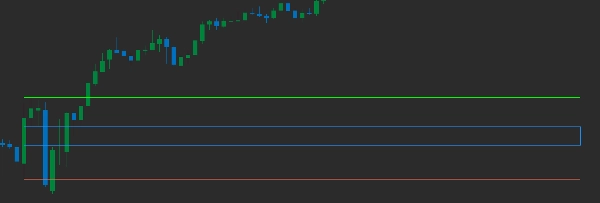
- يقوم هذا المؤشر برسم نطاق الافتتاح لمدة 15 دقيقة لجلسة نيويورك مع أول N من فجوات القيمة العادلة (FVGs) المعروضة على الرسم البياني بعد الافتتاح
يمكن للمستخدم:
تغيير بداية ونهاية نطاق الافتتاح لتناسب جلسات أخرى.
تحديد الإطار الزمني لفجوات القيمة العادلة التي سيتم رسمها.
تعديل الألوان لتناسب تفضيلاتك.
ملاحظة أن هذا مجرد مؤشر وليس معدًا لتقديم نصائح مالية من أي نوع.
أخبرني برأيك لمزيد من التحسينات.
شكراً لك
الملخص
ملخص الذكاء الاصطناعي
The ORB Range with FVGs indicator plots the 15-minute opening range of the New York trading session on the chart, along with the first N Fair Value Gaps (FVGs) that appear after the session opens. Users can customize the indicator by adjusting the opening range start and end times to accommodate other trading sessions. Additionally, the timeframe for the FVGs displayed can be defined according to user preference. Color settings are also editable to match individual chart styles. This tool is designed to assist traders analyzing Forex, indices, and popular symbols such as EURUSD, GBPUSD, XAUUSD, NAS100, and USDJPY. It supports strategies including breakout and scalping by visually highlighting key price ranges and imbalances. The indicator serves as a visual aid and does not provide financial advice.
ملف تعريف المؤشر
تقييمات العملاء
1.0
التقييمات: 1
5 | 0 % | |
4 | 0 % | |
3 | 0 % | |
2 | 0 % | |
1 | 100 % |
مناقشة
الأسئلة الشائعة
Forex
Breakout
Scalping
Indices
EURUSD
GBPUSD
Fair Value Gap
XAUUSD
NAS100
USDJPY
يتم توفير المنتجات المتاحة من خلال cTrader Store، بما في ذلك روبوتات التداول والمؤشرات والإضافات، من قبل مطوري الطرف الثالث وإتاحتها لأغراض الوصول المعلوماتي والفني فقط. cTrader Store ليس وسيطًا ولا يقدم نصائح استثمارية أو توصيات شخصية أو أي ضمان للأداء المستقبلي.
المزيد من هذا المؤلف


السعر
منذ 30/01/2025
36.05M
حجم التداول
26.73K
الربح بالبيب
1.24K
التثبيتات المجانية