
Previous day Key Levels
อินดิเคเตอร์
411 ดาวน์โหลด
เวอร์ชัน 1.0, Oct 2025
Windows, Mac
4.0
รีวิว: 1
คำอธิบาย
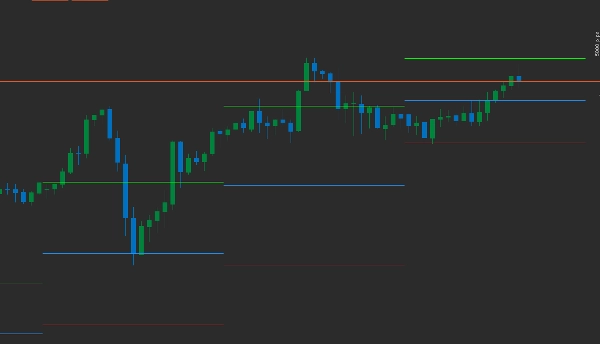
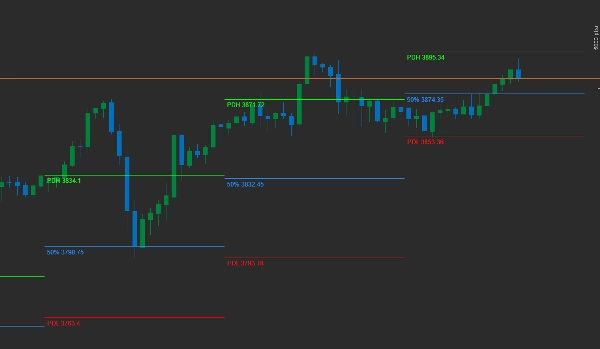
ตัวบ่งชี้นี้จะแสดงระดับสูงสุด ต่ำสุด และการถอยกลับ 50% ของวันก่อนหน้า
ผู้ใช้สามารถเปิด/ปิดประวัติได้
เมื่อเปิดใช้งานประวัติ คุณสามารถเลือกจำนวนวันที่ต้องการดูได้
เปลี่ยนสีของแต่ละเส้น
เปิด/ปิดป้ายที่ระบุแต่ละเส้น
สรุป
สรุปโดย AI
The Previous Day Key Levels indicator plots the prior trading day's High, Low, and 50% retracement levels on the chart. Users can customize the display by enabling or disabling historical data and selecting the number of past days to view. The indicator allows color customization for each line and the option to show or hide labels identifying each level. It supports various markets and symbols including Forex pairs (EURUSD, GBPUSD, NZDUSD, USDJPY), cryptocurrencies (BTCUSD, crypto), commodities (XAUUSD, gold, oil, silver), indices (NAS100, Dow, S&P 500, DAX), and stocks. This tool is designed to assist traders in identifying key price levels from the previous day that may influence current market behavior.
โปรไฟล์อินดิเคเตอร์
รีวิวจากลูกค้า
4.0
รีวิว: 1
5 | 0 % | |
4 | 100 % | |
3 | 0 % | |
2 | 0 % | |
1 | 0 % |
รีวิวจากลูกค้า
December 1, 2025
Previous Day Key Levels marks yesterday’s High, Low, Open, Close and midpoint - clean, fast and reliable. Great for intraday structure, liquidity zones and reaction points. Lightweight and useful on any timeframe. Alerts and range-zone shading would make it even better.
การสนทนา
คำถามที่พบบ่อย
BTCUSD
Forex
Breakout
Indices
EURUSD
Commodities
GBPUSD
NZDUSD
Scalping
Crypto
Stocks
XAUUSD
NAS100
USDJPY
ผลิตภัณฑ์ที่มีให้บริการผ่าน cTrader Store รวมถึงบอทการเทรด อินดิเคเตอร์ และปลั๊กอิน มีให้บริการโดยนักพัฒนาบุคคลที่สามและมีไว้เพื่อวัตถุประสงค์ในการเข้าถึงข้อมูลและทางเทคนิคเท่านั้น cTrader Store ไม่ใช่โบรกเกอร์และไม่ได้ให้คำแนะนำการลงทุน คำแนะนำส่วนบุคคล หรือการรับประกันผลการดำเนินงานในอนาคต
เพิ่มเติมจากผู้เขียนคนนี้


!["Trend Angle Indicator [Iridio Capital]" โลโก้](https://cdn.ctrader.com/image/webp/28a98496-3412-4fea-82eb-be3347bdd6f1_27612)


ราคา
ตั้งแต่ 30/01/2025
36.05M
ปริมาณการเทรด
26.73K
Pips ที่ได้กำไร
1.24K
ติดตั้งฟรี