Açıklama
Trend Scope Pro, tüccarlara piyasa yapısı ve fiyat yönü hakkında daha derin bir anlayış kazandırmak için tasarlanmış profesyonel düzeyde bir teknik göstergedir. Gelişmiş doğrusal regresyon algoritmaları üzerine kurulu olan bu araç, üç standart sapma kanalı seviyesi ile birlikte dinamik bir regresyon çizgisi hesaplar. İstatistiksel doğruluğu görsel netlikle birleştirerek, mevcut piyasa trendlerini, potansiyel dönüş bölgelerini ve volatilite aralıklarını kolayca tanımlamanıza yardımcı olur ve böylece her türlü ticaret araç setine erişilebilir ama güçlü bir ek sağlar.
Trend Scope Pro Nasıl Okunur
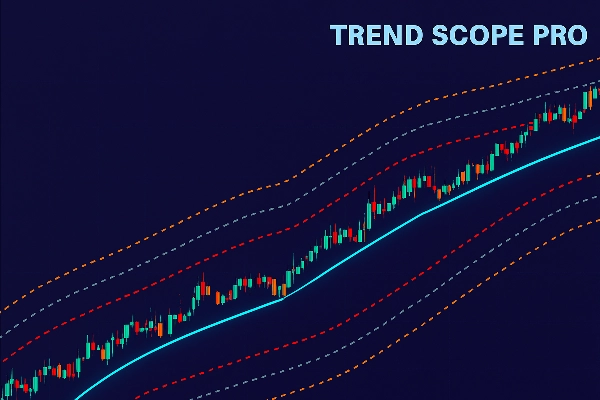
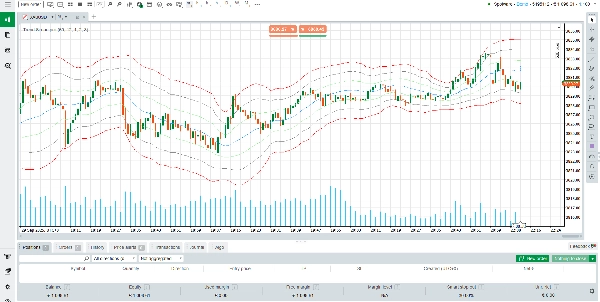
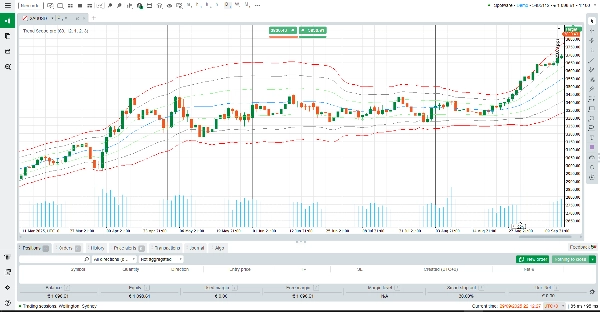
Grafiğinize uygulandığında, Trend Scope Pro, tanımlı bir dönem boyunca “adil değer” veya ortalama trend yönünü temsil eden merkezi bir regresyon çizgisi (mavi) çizer. Bu çizginin etrafında, üç set üst ve alt kanal çizilir (turuncu, gri ve kırmızı). Her kanal farklı bir standart sapma çarpanı kullanılarak hesaplanır:
Üst/Alt 1 (Turuncu): İlk standart sapmayı temsil eder. Bu bölgedeki fiyat hareketleri genellikle normal kısa vadeli volatiliteyi yansıtır.
Üst/Alt 2 (Gri): Daha güçlü sapmaları işaret eder. Bu bölgeye ulaşmak genellikle genişlemiş bir hareket veya gelişen momentum sinyali verir.
Üst/Alt 3 (Kırmızı): Piyasanın aşırı alım veya aşırı satımda olabileceği aşırı bölgeler olup, potansiyel dönüş fırsatları yaratır.
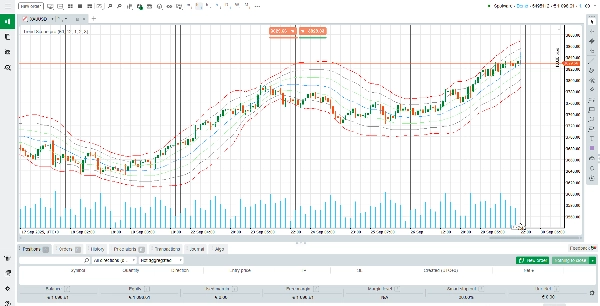
Pratikte, tüccarlar regresyon çizgisini trend yönünü doğrulamak için kullanabilirken, kanallar dinamik destek ve direnç seviyeleri olarak işlev görür. Örneğin:
Fiyat sürekli olarak regresyon çizgisinin üzerinde kalıyorsa, trend yükseliş eğilimindedir.
Fiyat tekrar tekrar regresyon çizgisini test ediyor veya altına kırıyorsa, trend zayıflıyor demektir.
Kırmızı kanallardaki aşırı temaslar, dönüşlerin veya geri çekilmelerin daha olası olduğu tükenme noktalarını vurgulayabilir.
Gösterge Nasıl Çalışır
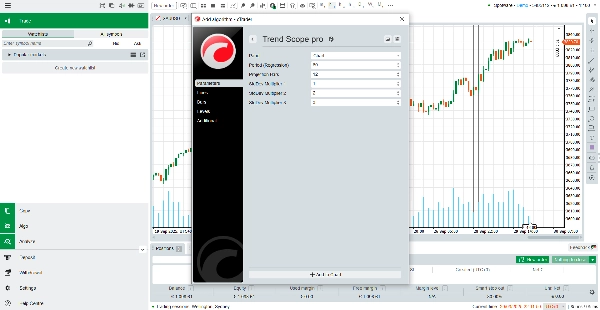
Trend Scope Pro, seçilen geri bakış dönemindeki kapanış fiyatlarını analiz ederek bir regresyon çizgisi hesaplar. Ardından, fiyatın bu çizgiden standart sapmasını ölçer ve bu da her kanalın genişliğini belirler. Bu istatistiksel yaklaşım, göstergenin gerçek zamanlı volatiliteye uyum sağlamasını sağlar ve trend takip sinyalleri ile ortalamaya dönüş içgörüsü arasında bir denge sunar.
Varsayılan ayarlar (60 bar geri bakış, çarpanlar 1.0, 2.0, 3.0) çoğu enstrüman için optimize edilmiştir, ancak stratejinize veya zaman diliminize uyacak şekilde kolayca ayarlayabilirsiniz. İster gün içi girişler arayan bir gün içi tüccarı olun, ister daha geniş piyasa döngülerini analiz eden bir salınım tüccarı olun, Trend Scope Pro karar verme için güvenilir bir bağlam sunar.
Trend Scope Pro'nun Temel Özellikleri
Uyarlanabilir Doğrusal Regresyon – Kesin yönsel eğilim için merkezi piyasa trendini dinamik olarak hesaplar.
Çok Seviyeli Kanallar – Üç set sapma bantları normal hareketleri, güçlü trendleri ve aşırı koşulları tanımlamaya yardımcı olur.
Görsel Netlik – Temiz ve renk kodlu çizgiler, fiyat hareketini bir bakışta yorumlamayı kolaylaştırır.
Özelleştirilebilir Ayarlar – Her türlü ticaret stiline uyacak esnek geri bakış dönemleri ve sapma çarpanları.
Özetle, Trend Scope Pro istatistiksel güvenilirliği pratik kullanılabilirlikle birleştirir. Sadece bir trend çizgisi değil—fiyat davranışını analiz etmek, yüksek olasılıklı bölgeleri belirlemek ve işlem zamanlamasını iyileştirmek için eksiksiz bir çerçevedir. İster trend onayı arıyor, ister dönüşleri öngörüyor ya da sadece grafiklerinize yapı ekliyor olun, Trend Scope Pro ihtiyacınız olan netlik ve güveni sunar.
Özet
Müşteri değerlendirmeleri
5 | 50 % | |
4 | 50 % | |
3 | 0 % | |
2 | 0 % | |
1 | 0 % |


