
説明
サウンドアラート付きテクニカル分析
TECHNICAL ANALYSISインジケーターは、cAlgoプラットフォーム向けに開発された高度なテクニカル分析ソリューションであり、堅牢なトレンド、市場の勢い、ボリュームの確認に焦点を当てた複数のテクニカル指標を統合しています。ADX(平均方向性指数)を傾き分析、ボリュームフィルタリング、リアルタイムのマルチインジケーター技術分析と組み合わせ、トレーダーに包括的で信頼性の高い意思決定の視点を提供します。
🔍 主な戦略
1. 基本:ADX + DI(方向性運動システム)
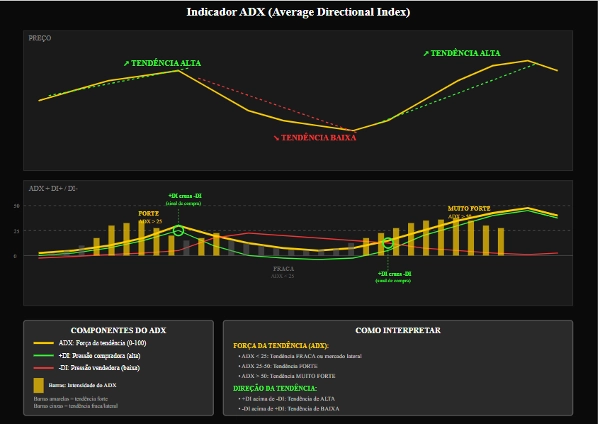
インジケーターの核はトレンドの強さを測定するADX(平均方向性指数)です。
+DI(正の方向性指標)と-DI(負の方向性指標)はトレンドの方向を識別します:
+DI > -DI → 上昇トレンド
-DI > +DI → 下降トレンド
2. 傾きによる動的モメンタム分析
ADX、+DI、-DIの傾きは線形回帰を用いて計算されます。
これにより、トレンドが以下のどちらかを識別できます:
強まっている(正の傾き)
弱まっている(負の傾き)
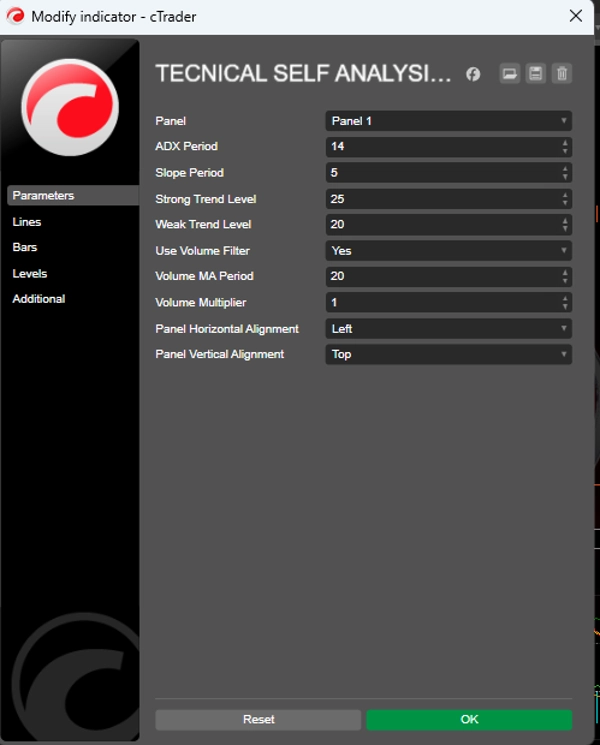
3. 参照レベル
強いトレンドレベル:トレンドが強いと見なされるレベル(デフォルト:25)
弱いトレンドレベル:有効なトレンドと見なす最小レベル(デフォルト:20)
弱いレベル以下のトレンドは横ばいまたは明確な方向性なしと見なされます。
📈 シグナル生成
買い条件
✅ +DIが-DIを上抜ける
✅ ADXが弱いトレンドレベル以上(弱いトレンドレベル)
✅ ADXと+DIの傾きが正
✅ ボリューム確認(オプション)
売り条件
✅ -DIが+DIを上抜ける
✅ ADXが弱いトレンドレベル以上(弱いトレンドレベル)
✅ ADXと-DIの傾きが正
✅ ボリューム確認(オプション)
強いシグナル:ADXが強いトレンドレベル以上で傾きが大幅に正の場合、インジケーターは強化されたシグナルを生成し、連続した繰り返しエントリーを回避します。📊 ボリュームフィルター(オプション)
インジケーターはシグナル生成前にボリューム確認を要求する場合があります。
現在のボリュームは、ボリュームの移動平均×乗数以上でなければなりません。
これにより、流動性の低い市場での偽のブレイクアウトやシグナルをフィルタリングします。
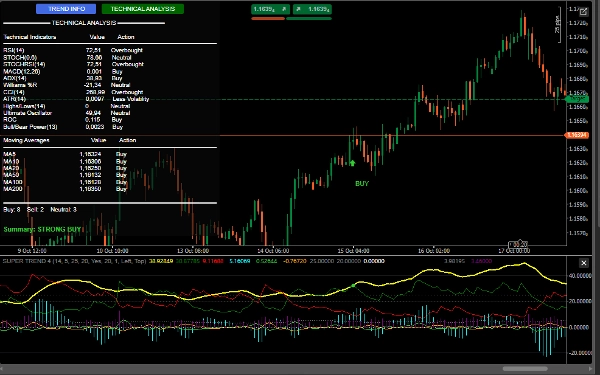
🧠 高度なテクニカル分析(インタラクティブパネル)
TECHNICAL ANALYSISにはチャート上に2つのインタラクティブパネルがあります:
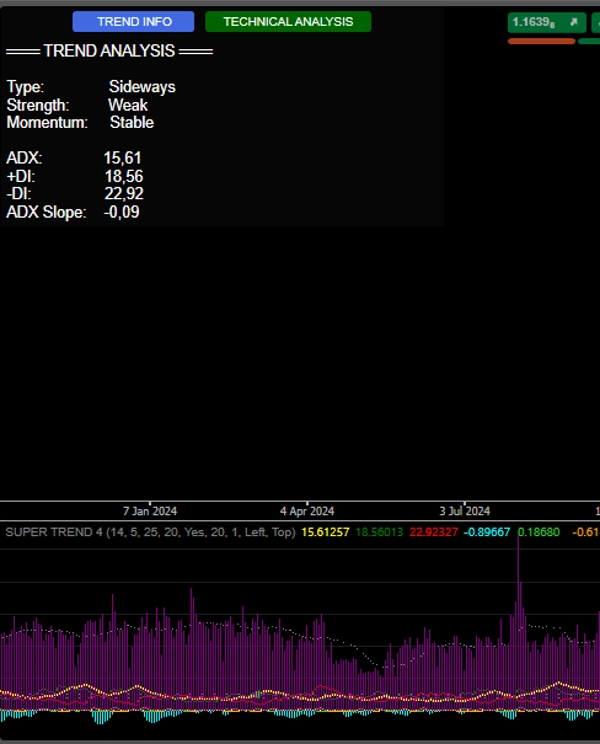
1. トレンド情報
トレンドタイプ:上昇トレンド / 下降トレンド / 横ばい
トレンド強度:強い / 弱い
モメンタム:強化中 / 弱化中 / 安定
現在のADX、+DI、-DIおよび傾きの値
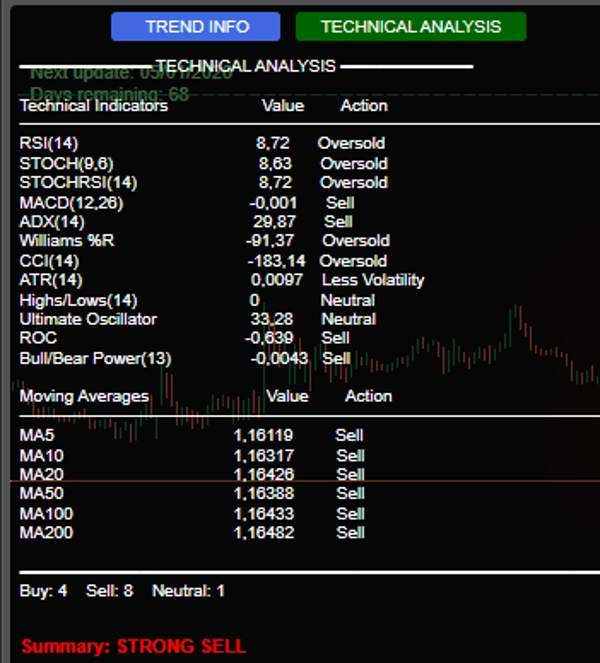
2. テクニカル分析
以下を含むリアルタイムのマルチインジケーター分析を実行します:
RSI(14) – 過買い/過売り
ストキャスティクス(14) – モメンタム
MACD(12,26) – クロスおよびダイバージェンス
ウィリアムズ %R – 市場の極値
CCI(14) – 典型価格からの偏差
ROC(12) – 変化率
アルティメットオシレーター – 強さの確認
ブル/ベアパワー – 買い/売り圧力
移動平均線 (5,10,20,50,100,200) – 長期トレンド
最終まとめ:システムは買い/売り/中立のシグナルをカウントし、明確な推奨を発行します:
強い買い(買いシグナル7以上)
買い
売り
強い売り(売りシグナル7以上)
中立
🔔 アラートと視覚化
チャート上の視覚的シグナル:
「BUY」/「SELL」ラベル付きの緑/赤の矢印
サウンド通知(Windows)
コンソールの詳細ログには以下が含まれます:
シグナル時間
ADX、DIおよびボリュームの値(有効な場合)
🛡️ 競争上の利点
✅ 複数の指標を単一のダッシュボードに統合
✅ トレンドの強さと方向に焦点(価格だけでなく)
✅ 信頼性向上のためのボリュームフィルター
✅ インタラクティブで情報豊富なインターフェース
✅ 視覚的および聴覚的アラートによる明確なシグナル


