
Dynamic Trend Flux
インジケーター
バージョン 1.0、Nov 2025
Windows、Mac
4.0
レビュー: 1
説明
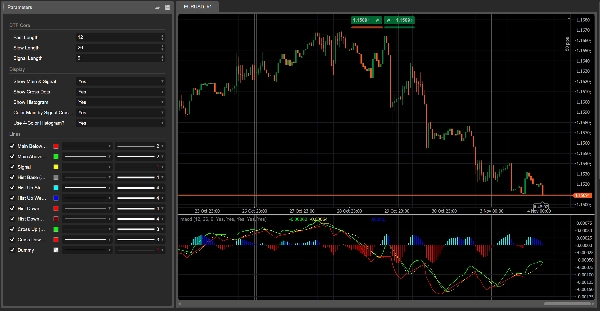
ダイナミックトレンドフラックス
タイプ: モメンタム / トレンドオシレーター(MACDスタイル、多色)
その機能
ダイナミックトレンドフラックスは カラー付きモメンタムオシレーターで、クラシックな高速/低速EMA差分とシグナルラインに基づいています。
一目で以下を確認できます:
- いつ モメンタムが強気か弱気か、
- モメンタムが 強まっているか弱まっているか、
- そしてどこで トレンドの変化が起こるか(メインラインとシグナルラインの交差)。
インジケーターは以下を描画します:
- メインライン(フラックスライン)
-
- 高速EMAと低速EMAの差分から構成されます
- シグナルライン(オプション)の 上か下か によって色が変わります。
- シグナルライン
-
- メインラインの移動平均で、 滑らかなトリガーとして使われます。
- 4色のヒストグラム(オプション)
-
- メインラインとシグナルラインの距離を表示し、
- 色は 方向(ゼロの上/下)と 強さの変化をバーごとに表します。
- 交差点のドット(オプション)
-
- メインラインがシグナルラインを横切る場所を強調表示し、→ 潜在的な トレンドフェーズの変化を示します。
すべての計算は 現在のチャートの時間枠で行われます。
読み方
1. ゼロライン
- 値が ゼロより上 → 強気圧力が優勢。
- 値が ゼロより下 → 弱気圧力が優勢。
2. カラー付きヒストグラム
4色モードがONの場合:
- アクア → ゼロより上で上昇中
-
- 強く / 増加している強気のモメンタム。
- ブルー → ゼロより上だが下降中
-
- 強気トレンドは継続中だが、モメンタムは 冷めている。
- レッド → ゼロより下で下降中
-
- 強く / 増加している弱気のモメンタム。
- マルーン → ゼロより下だが上昇中
-
- 弱気フェーズは継続中だが、モメンタムは 勢いを失っている。
これにより、ダイバージェンスやモメンタムの変化を視覚的に非常に見つけやすくなります。
3. メインラインとシグナルライン
- メインラインが シグナルの上 → 強気フェーズ。
- メインラインが シグナルの下 → 弱気フェーズ。
色の変更が有効な場合:
- メインラインが ライム = シグナルの上(強気の支配)
- メインラインが レッド = シグナルの下(弱気の支配)
4. 交差点のドット
- グリーンドット(クロスアップ)→ メインラインが シグナルの上を横切る
-
- 強気スイングの 開始の可能性。
- レッドドット(クロスダウン)→ メインラインが シグナルの下を横切る
-
- 弱気スイングの 開始の可能性。
これらのシグナルは常に構造/価格アクションおよび上位時間枠のコンテキストと組み合わせて使用してください。
パラメーター(英語)
DTFコア
- 高速期間 – 高速EMAの期間(デフォルト12)。
- 低速期間 – 低速EMAの期間(デフォルト26)。
- シグナル期間 – メインラインに適用されるシグナルSMAの期間(デフォルト9)。
表示
- メイン&シグナル表示 – 2本のラインの切り替え。
- 交差点ドット表示 – メイン/シグナルの交差点にドットを表示。
- ヒストグラム表示 – 背景のヒストグラムの切り替え。
- シグナル交差によるメインの色変更?
-
- ON → メインラインはシグナルの上で ライム、下で レッド。
- OFF → メインラインは常に レッドのまま。
- 4色ヒストグラムを使用?
-
- ON → アクア / ブルー / レッド / マルーンのロジック。
- OFF → ヒストグラムは単一の グレー色。
概要
インジケーターのプロフィール
カスタマーレビュー
4.0
レビュー: 1
5 | 0 % | |
4 | 100 % | |
3 | 0 % | |
2 | 0 % | |
1 | 0 % |
ディスカッション
よくあるご質問
Signal
Indices
Commodities
GBPUSD
RSI
Bollinger
Fibonacci
Scalping
AI
XAUUSD
NAS100
MACD
BTCUSD
Forex
Breakout
EURUSD
NZDUSD
Martingale
Prop
ZigZag
Supertrend
Fair Value Gap
SMC
Crypto
Grid
Stocks
ATR
USDJPY
VWAP
cTrader Storeで入手可能な取引ボット、インジケーター、プラグインなどの商品は、第三者の開発者が提供するものであり、情報と技術の取得のみを目的としてご利用いただけます。cTrader Storeはブローカーではなく、投資助言や個人的な推奨を行うことも、将来のパフォーマンスを保証することもありません。


価格
42.11M
取引数量
6.13M
獲得pips
222
販売
8.38K
無料インストール