
説明
HiLoマーカー:重要な市場の転換点を明らかにする
HiLoマーカー は、定義された過去の期間に基づいて重要な価格の高値と安値を自動的に検出し強調表示するよう設計された直感的で不可欠なcTraderインジケーターです。このツールは、スイングポイントの特定における推測を排除し、あらゆるプライスアクショントレーダーに視覚的な優位性を提供することでチャートの明確さをもたらします。
仕組み
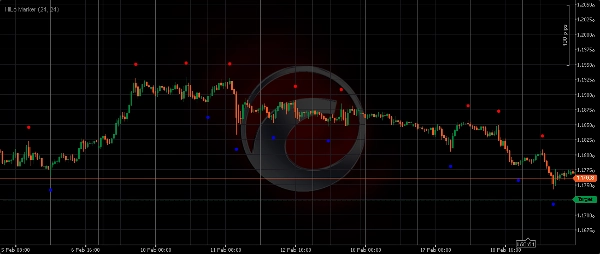
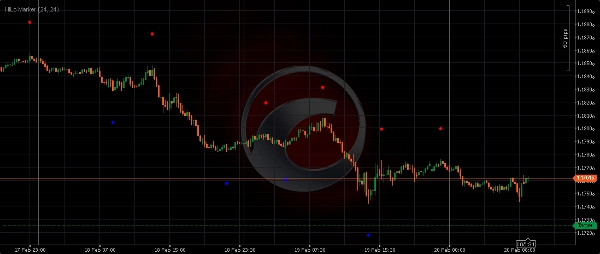
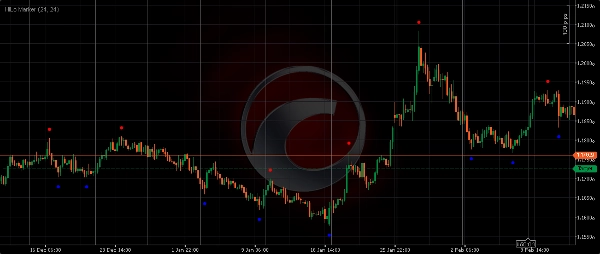
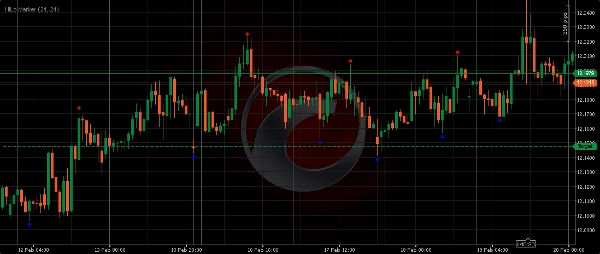
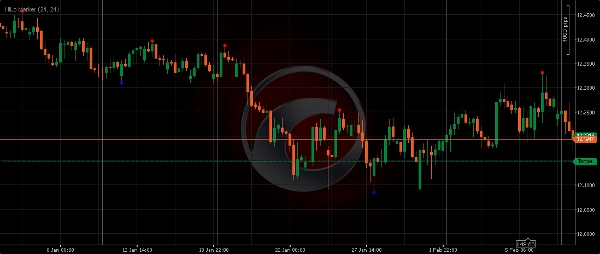
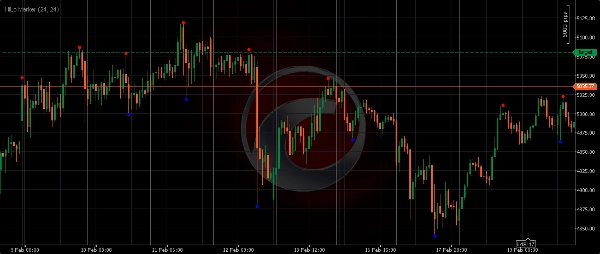
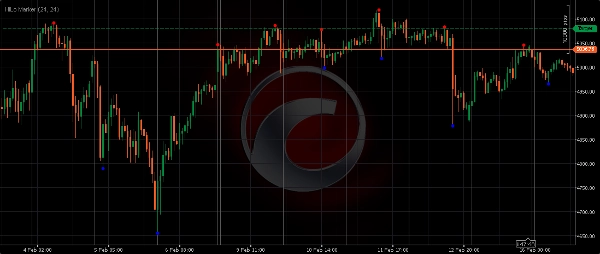
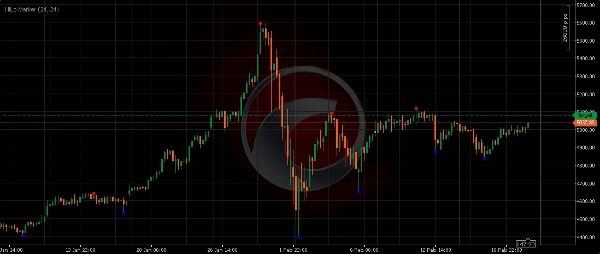
インジケーターは指定された「距離ウィンドウ」(バー数)をスキャンして、その範囲内で絶対的に最も高い高値と最も低い安値を見つけます。バーがその周囲のウィンドウのピークまたは谷として確認されると、HiLoマーカー はそのローソク足の上または下に赤または青の点(または矢印)を配置します。この方法により、価格が以前に反転したり強い勢いを見せた重要なレベルを客観的に特定できます。
主な特徴と利点
- 自動化された精度: 手動でラインを引く必要はありません。HiLoマーカーは重要な転換点を客観的に識別します。
- 明確な市場構造: スイング、トレンド、レンジを瞬時に視覚化し、チャート分析をより効率的にします。
- サポート&レジスタンスゾーン: マークされた高値と安値は将来のサポートやレジスタンスとして機能することが多く、高確率のエントリー/エグジットポイントを提供します。
- 多用途: すべての金融商品(外国為替、ゴールド、指数、暗号通貨、株式)および任意の時間枠で完璧に機能します。
- カスタマイズ可能なビジュアル: マーカーの色やオフセット距離を調整してチャートに完璧に統合できます。
入力パラメーターの説明:
- 長さ(オフセット): この値は、マーカーが高値の上または安値の下にどれだけ離れてプロットされるかを決定します。値が大きいほどローソク足からの視覚的な分離が大きくなります。
-
- 例:
Length = 24はマーカーが実際の高値/安値から24ピップ(またはシンボルに応じてティック)離れて表示されることを意味します。
- 例:
- 距離ウィンドウ: これはインジケーターが高値または安値を特定するために使用する過去の期間です。この指定された周囲のバー数の中で絶対的に最高/最低である場合にのみバーがHi/Loとしてマークされます。
-
- 小さい
Dist(例:10-20): 小さなスイングや短期の市場ノイズを捉えます(スキャルピングに適しています)。 - 大きい
Dist(例:30-60以上): より重要な機関レベルのスイングや主要なトレンドの反転を特定します(スイングトレードやより長い時間枠に理想的です)。
- 小さい
HiLoマーカーでプライスアクショントレードを強化しましょう。市場の動態をより明確に把握し、より情報に基づいた意思決定を行いましょう。今すぐダウンロード!
概要
インジケーターのプロフィール
カスタマーレビュー
4.0
レビュー: 2
5 | 0 % | |
4 | 100 % | |
3 | 0 % | |
2 | 0 % | |
1 | 0 % |
カスタマーレビュー
February 21, 2026
the signal still needs a chart check, no surprise there. Demo first makes more sense.
February 21, 2026
Half size is enough at the start, and the poor entries show up earlier.
ディスカッション
よくあるご質問
BTCUSD
Fibonacci
Signal
ZigZag
Scalping
EURUSD
GBPUSD
NZDUSD
SMC
XAUUSD
NAS100
USDJPY
cTrader Storeで入手可能な取引ボット、インジケーター、プラグインなどの商品は、第三者の開発者が提供するものであり、情報と技術の取得のみを目的としてご利用いただけます。cTrader Storeはブローカーではなく、投資助言や個人的な推奨を行うことも、将来のパフォーマンスを保証することもありません。


価格
登録日 17/02/2026