

説明
Smart Money Suite Pro — cTrader向けの完全な機関投資家向けプライスアクションツールキット
スマートマネーコンセプトや機関投資家の注文フローに基づくプライスアクション手法を使って取引しているなら、その悩みはご存知でしょう:チャートに散らばった十数個のインジケーター、それぞれが部分的に機能しているものの、互いに連携していません。Smart Money Suite Proはそれを完全に解決するために作られました。
これは単一の自己完結型インジケーターで、機関投資家のプライスアクションとスマートマネー手法の主要な概念すべてをカバーしています。cTrader向けにゼロから設計され、ライブチャート上でちらつきなくスムーズに動作するよう最適化されており、実際の取引セッションで本当に使いやすい生活の質を向上させる機能が満載です。
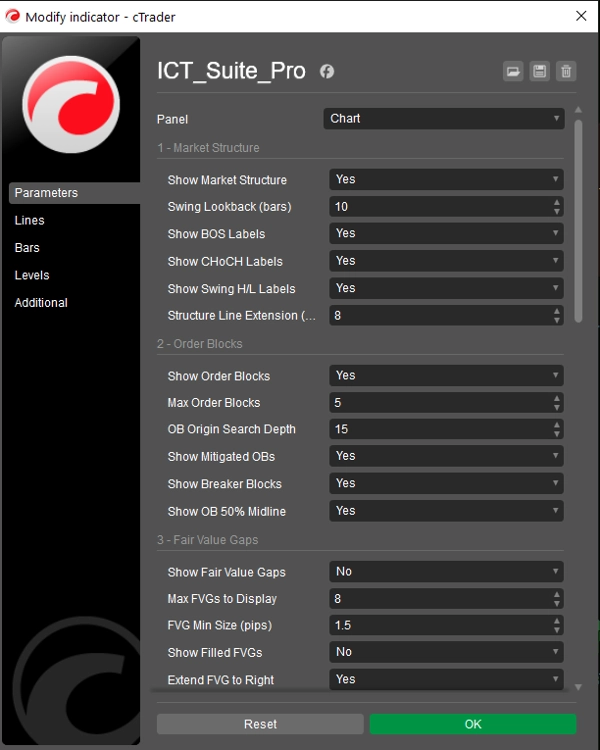
マーケット構造 — 自動かつ正確
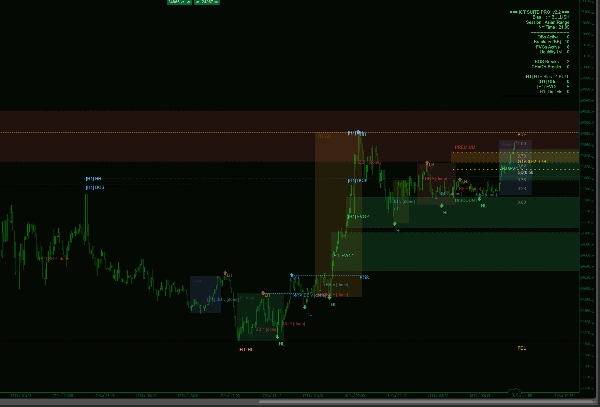
インジケーターはチャートを継続的にスキャンし、確定したスイング高値と安値を検出し、それぞれをHigher High、Lower High、Higher Low、Lower Lowとして分類します。すべての構造の破壊(BOS)とキャラクターの変化(CHoCH)が検出され、点線レベルラインでラベル付けされるため、価格がどこで前の構造を破ったかを正確に確認できます。BOS(トレンド継続)とCHoCH(トレンド反転)の区別は色分けされており、一目で判別可能です。スイングの遡及深度は完全に調整可能です。
オーダーブロック — 完全なライフサイクルトラッキング付き
オーダーブロックは、確定したスイングに至る各インパルスムーブの直前の反対のローソク足を特定することで識別されます。各ブロックはチャートの右側に色付きのボックスとして描画され、価格がゾーンに戻ったかどうかを一目で確認できます。オーダーブロックが軽減されると、矩形は削除され、薄いテキストマーカーに置き換えられ、チャートをきれいに保ちながらレベルの記録を保持します。その後、価格が軽減されたオーダーブロックの反対側を突破すると、それはブレーカーブロックとして再分類され、色が変わり、潜在的な反転ゾーンを示します。各アクティブブロック内には50%の中間線が描かれ、ゾーン内のプレミアム/ディスカウントの分割を強調します。
フェアバリューギャップ — 埋まるまで追跡
3本のローソク足の価格の不均衡が両方向で、全遡及ウィンドウにわたって検出されます。各ギャップは設定可能な最小ピップサイズでフィルタリングされ、ノイズを排除します。未埋めのギャップは価格が戻って閉じるまでチャートの右側に延長され、その時点で設定に応じて削除されるか埋まったとマークされます。強気と弱気の不均衡の両方が同時に処理されます。
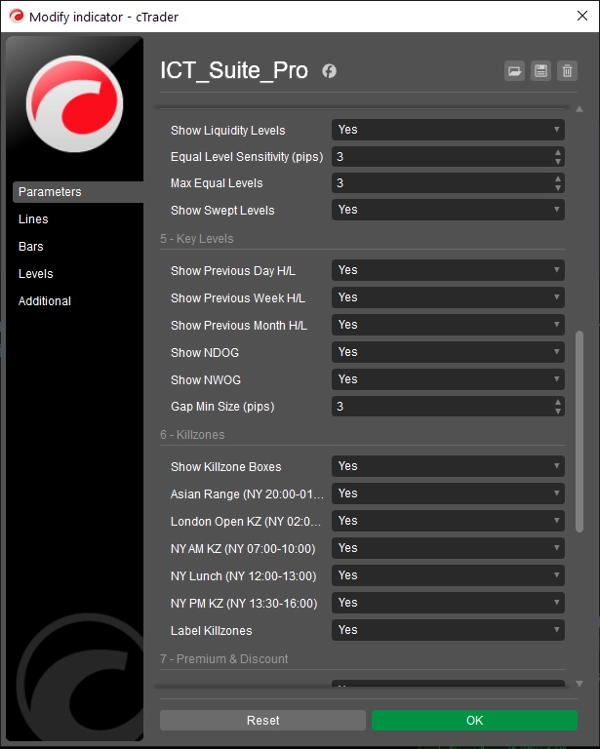
流動性レベル — イコールハイとイコールロー
インジケーターは、設定可能なピップ許容範囲内にあるスイング高値またはスイング安値のクラスターをスキャンし、機関投資家の注文フローが狙う買い側および売り側の流動性プールを特定します。各レベルは両スイングポイントにティックマークが描かれ、右側に点線が投影されます。価格が流動性レベルを通過すると、設定に応じて非表示にするかスイープ済みとしてマークされます。
重要レベル — 前日、前週、前月
前日の高値/安値、前週の高値/安値、前月の高値/安値は、チャートの価格データから自動的に計算されます。すべての日付境界はブローカーのバーのタイムスタンプから派生しており、ローカルシステムクロックではないため、タイムゾーンや銘柄のロールオーバーに関係なく正確に保たれます。各レベルペアは異なる色と線種を使用し、チャート上で重なっても見やすくなっています。
オープニングギャップ — 日次および週次
インジケーターは、前のセッションの終値と現在のセッションの始値の間の価格ギャップを毎日および毎週のオープンでスキャンします。定義された最小ピップサイズを超えるギャップは色付きの矩形として描画されます。新しい日のオープニングギャップと新しい週のオープニングギャップは異なる色で区別され、どのギャップが未埋めかを即座に把握できます。
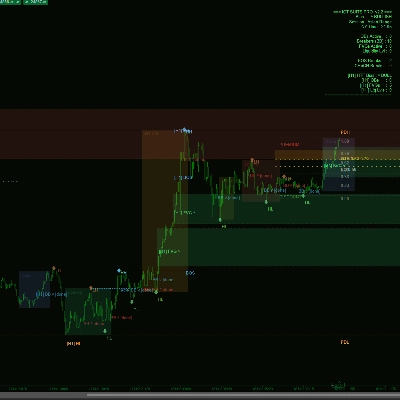
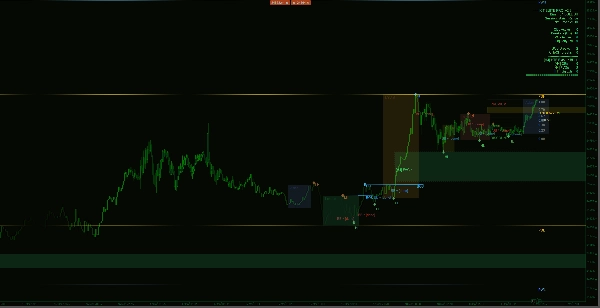
セッションキルゾーン — 実際のレンジボックス付き
アジア、ロンドンオープン、ニューヨーク午前、ニューヨーク昼休み、ニューヨーク午後のセッションウィンドウは、それぞれの期間中に形成された実際の高値から安値の範囲を満たすボックスとして描画されます。時間はニューヨーク時間に基づき、EDT/ESTの夏時間に自動調整されます。各ボックスは個別に切り替えおよびラベル付け可能です。ボックスは固定の垂直線ではなく実際の価格レンジを反映しているため、各セッションがどれだけ活発だったか、価格がどこで極値を見つけたかを即座に確認できます。
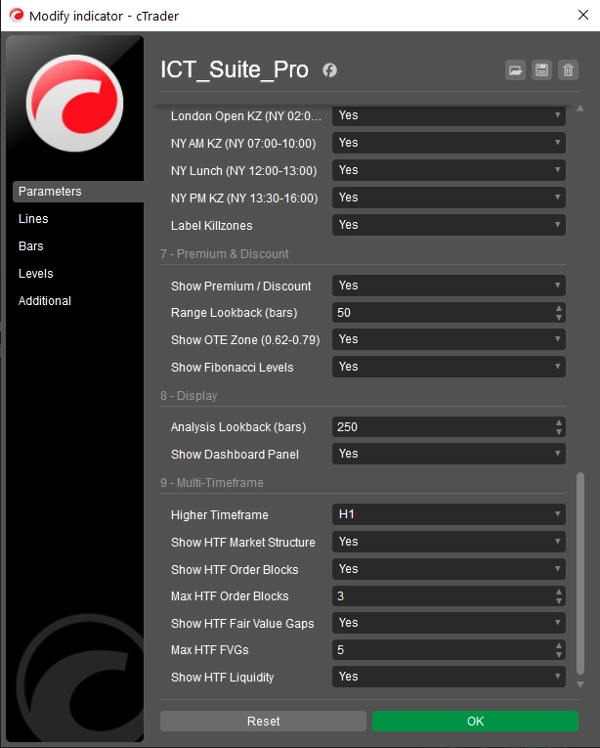
プレミアム&ディスカウントゾーン — 最適なエントリー範囲付き
ローリングレンジ分析により、設定可能な遡及期間内の最高高値と最低安値が計算されます。このレンジから、インジケーターは均衡点(0.50)、最適なエントリーゾーン(0.62–0.79のフィボナッチ)、および主要なフィボナッチリトレースメントレベルの全セットを描画します。プレミアムとディスカウントのラベルはレンジ内に配置され、現在の取引レンジのどちらの半分で価格が取引されているかを常に把握できます。遡及期間は表示されているバーウィンドウに自動的に合わせて制限されるため、見えないバーを参照するレベルはありません。
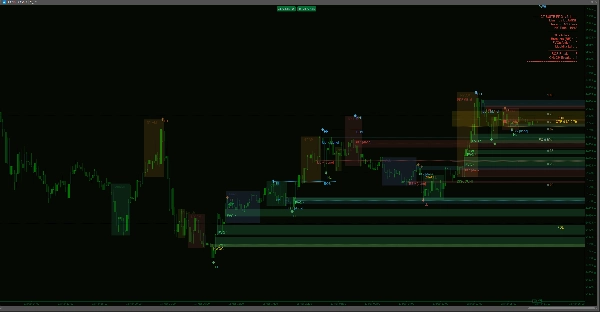
マルチタイムフレームオーバーレイ — 目玉機能
MTFシステムは、現在のチャートのバーを時間に合わせたスロットに集約して上位時間軸のローソク足を再構築します — 別途データ購読は不要です。ドロップダウンから上位時間軸を選択すると(M5、M15、M30、H1、H4、D1)、Smart Money Suite Proは上位時間軸のオーダーブロック、フェアバリューギャップ、マーケット構造、流動性レベルを現在のチャート上に直接計算・描画します。上位時間軸のアイテムは視覚的に区別されており、太い境界線、破線のアウトライン、時間軸タグ(例: [H4] OB ^)がラベルの前に付くため、どの時間軸のレベルかが常にわかります。
現在のチャート時間軸と同じかそれ以下の上位時間軸を選択した場合 — 不可能な設定 — インジケーターは画面に明確な警告を表示し、何も描画せず、誤解を招くデータの表示を防ぎます。
オーバーレイが有効な場合、ダッシュボードパネルは専用の上位時間軸セクションで更新され、HTFバイアス、アクティブなオーダーブロック数、フェアバリューギャップ数、流動性レベル数を現在の時間軸の概要と共に表示します。
ライブダッシュボード
きれいで右寄せのパネルに、現在の市場バイアス、アクティブな取引セッション、ニューヨーク時間、すべてのアクティブなオーダーブロック、ブレーカーブロック、フェアバリューギャップ、流動性レベルのカウント、そして遡及ウィンドウ内で検出されたBOSとCHoCHの合計数が表示されます。マルチタイムフレームオーバーレイが有効な場合は、上位時間軸の概要が自動的に下に追加されます。
ライブトレード向けに設計
インジケーターは新しいバーが形成されたときのみ再描画され、すべてのティックで再描画されるわけではないため、多くのオールインワンインジケーターに見られるチャートのちらつきを排除します。すべての分析は設定可能な遡及ウィンドウ内で実行されるため、バー数が多い低時間軸でもパフォーマンスが一貫して維持されます。


![「Gaussian Channel [Iridio Capital]」ロゴ](https://cdn.ctrader.com/image/webp/7c039209-5573-4a54-a072-f9528b503103_41960)


