
IR Multi Data
インジケーター
100 ダウンロード数
バージョン 1.0、Jan 2025
Windows、Mac
5.0
レビュー: 1
説明
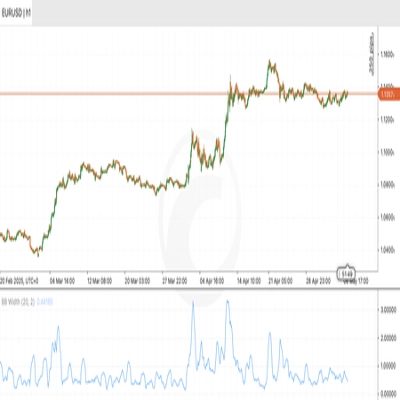
チャートにシンボルと時間枠、日次純利益率、日次純利益、およびスプレッドを表示します。
日次利益を正しく表示するために、タイムゾーンがUTCに設定されていることを考慮してください。
概要
インジケーターのプロフィール
カスタマーレビュー
5.0
レビュー: 1
5 | 100 % | |
4 | 0 % | |
3 | 0 % | |
2 | 0 % | |
1 | 0 % |
ディスカッション
よくあるご質問
cTrader Storeで入手可能な取引ボット、インジケーター、プラグインなどの商品は、第三者の開発者が提供するものであり、情報と技術の取得のみを目的としてご利用いただけます。cTrader Storeはブローカーではなく、投資助言や個人的な推奨を行うことも、将来のパフォーマンスを保証することもありません。


価格
5.12K
無料インストール