
説明
サポート&レジスタンスツールキットは、トレーダーがチャート上で高確率のサポートおよびレジスタンスゾーンを特定するのを支援するために設計された包括的な市場構造分析インジケーターです。複数の高度なピボットポイント検出アルゴリズムと適応的なボラティリティゾーン、機関投資家の資金流入フィルター、流動性分析を組み合わせることで、このツールキットは従来のサポートおよびレジスタンスラインをデータ駆動型の戦略的ツールに変換します。
検出
このツールキットには、異なる取引スタイルや市場環境に適した4つの高度な検出方法が含まれています:
- ピボット:設定可能な左および右のルックバック強度を使用して局所的な高値と安値を検出する、古典的なサポートおよびレジスタンス検出アプローチ。
- ドンチャン:方向性の状態が変わるときに極値を確認する、高性能のステートマシンアルゴリズムで、固定遅延を使用せずに交互のスイング構造を検出します。
- CSID:連続する強気または弱気のローソク足に基づいて構造的な転換点を特定し、強いトレンド開始ゾーンを強調するモメンタム駆動の検出方法。
- ジグザグ:スイングを特定する前に最小のパーセンテージ偏差を必要とすることで小さな価格変動をフィルタリングするボラティリティベースのアルゴリズム。
ゾーン / レベル
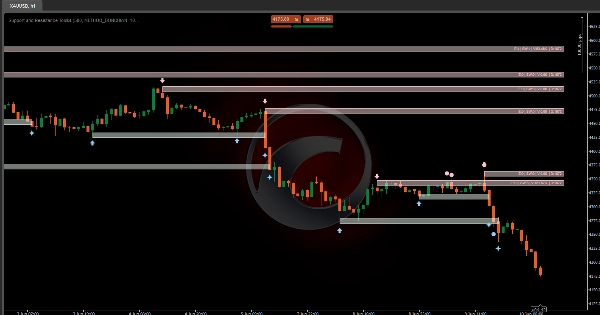
単に固定線を描く従来のインジケーターとは異なり、このツールはサポートおよびレジスタンスレベルを以下の特徴に基づく動的な価格ゾーンとして扱います:
- ゾーンの深さ(ATR乗数):平均真の範囲に基づいて各ゾーンの厚さを決定します。これにより、市場のボラティリティに応じてゾーンが自動的にスケールします。
- ブレイクアウトバッファ(ATR乗数):ゾーンをブレイクアウト側よりも拡張する独自のセキュリティバッファ。価格がこの追加のボラティリティ層を超えて動く必要があり、インジケーターがブレイクアウトを確認し、誤信号やフェイクアウトを減らします。
フィルタリング&可視性:
- 重複ゾーンの統合:交差するゾーンをより大きな「スーパーゾーン」に結合し、完全な歴史的相互作用範囲を表します。
- 最も古いものを先に非表示:重複が発生した場合、最近の市場構造を優先して古いゾーンを非表示にします。
- 最も新しいものを先に非表示:既存の範囲内に現れる小さな新しいゾーンを無視して確立された歴史的構造を保持します。
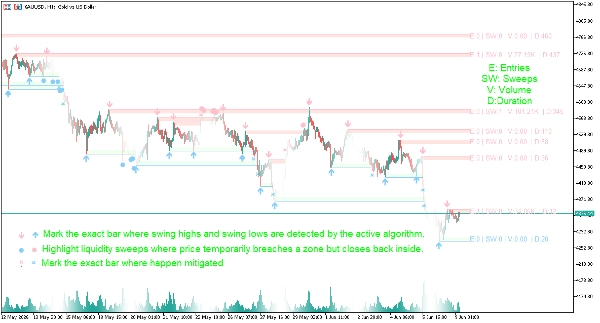
レベルフィルタリング(E:エントリー | S:強度 | SW:スイープ | V:ボリューム | D:期間)
- 価格エントリー(E):レベルがチャートに表示される前に指定された回数だけ再テストされる必要があります。
- スイープ(SW):価格が一時的にレベルをウィックで破るが、ゾーン内で終値をつける流動性トラップを検出します。
- 取引量(V):価格がゾーンと相互作用している間に発生する総取引量を追跡し、機関の参加を強調します。
- 期間(D)ゾーンが有効な構造レベルと見なされる前に、最低限のバー数生存する必要があります。
視覚的シグナル
- ⬆/⬇ 矢印:アクティブなアルゴリズムによってスイング高値とスイング安値が検出された正確なバーを示します。
- ● 大きな点:価格が一時的にゾーンを突破したが再び内部で終値をつけた流動性スイープを強調します。
- ✖ クロス:スイング高値とスイング安値が移動した正確なバーを示します。
- 概要ラベル:各表示エリアには、パラメーターE(エントリー)、S(強度)、SW(スイープ)、V(ボリューム)、D(期間)を含む簡潔なデータラベルがあり、ユーザーが構造の質を迅速に評価できます。
ダッシュボード
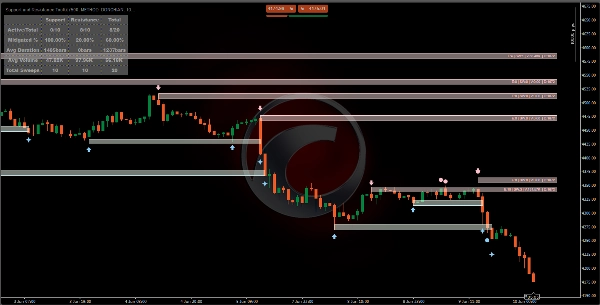
- アクティブ / 合計:現在アクティブな構造の数と歴史的に検出された合計数を表示します。
- 緩和率%:レベルが破られたり緩和された頻度を測定し、市場構造の信頼性に関する洞察を提供します。
- 平均期間:サポートまたはレジスタンスゾーンが破られる前に生存する平均バー数。
- 平均ボリューム:ブレイクアウトが発生する前のゾーン内の平均的な機関参加を示します。
- 総スイープ数:市場全体の流動性ハンティング行動を追跡します。
インジケーター設定
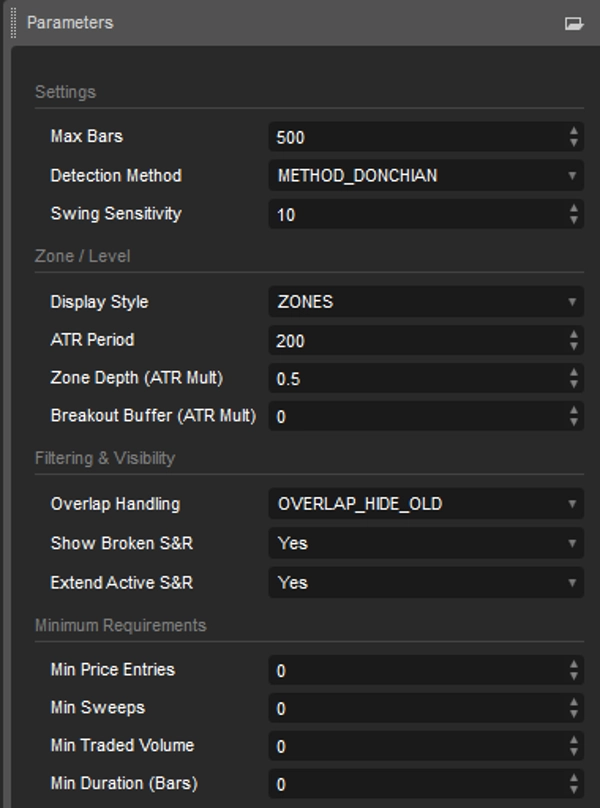
検出設定
- 検出方法ピボット、ドンチャン、CSID、またはジグザグのスイング検出ロジックから選択します。
- スイング感度スイング高値と安値を確認するために必要な偏差またはルックバックの長さを調整します。
ゾーン&レベル構成
- 表示スタイル正確な水平サポートおよびレジスタンスラインとATRベースのゾーンを切り替えます。
- ATR期間ゾーン計算に使用されるボラティリティ期間を決定します。
- ゾーンの深さ(ATR乗数)サポートおよびレジスタンスゾーンの厚さを調整します。
- ブレイクアウトバッファ(ATR乗数)誤ったブレイクアウトをフィルタリングするためのボラティリティバッファを追加します。
チャートの可視性&構造制御
- 重複処理重複ゾーンの処理方法を選択します(統合、最も古いものを非表示、または最も新しいものを非表示)。
- 最大アクティブ(未緩和)チャートに表示されるアクティブなサポートおよびレジスタンスゾーンの数を制限します。
- 破られたS&Rを表示破られたレベルが履歴分析のために表示されたままにするかどうかを切り替えます。
- アクティブS&Rを延長アクティブなレベルを将来の価格バーに投影します。
最小構造要件
- 最小価格エントリーレベルが表示される前に必要な再テスト回数を設定します。
- 最小スイープ数ゾーンを表示する前に必要な流動性スイープの数を要求します。
- 最小取引量ゾーンが最低限の機関参加閾値を満たすことを保証します。
- 最小期間(バー数)レベルが表示される前に指定されたバー数存在する必要があります。
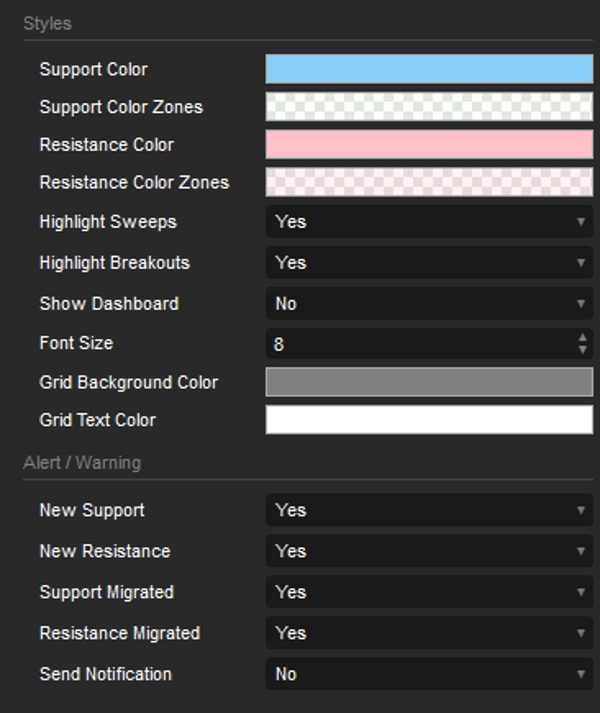
スタイルとアラート
- スタイルオブジェクトの色設定を調整します。ダッシュボードの表示/非表示。
- アラート新しいS&Rが検出されたり、S&Rが移動したときにアラートをオン/オフにします。
概要
AIによる概要
The Support and Resistance Toolkit is a market structure indicator designed to identify high-probability support and resistance zones on trading charts. It integrates four advanced swing detection methods—Pivots, Donchian, CSID (momentum-based), and ZigZag (volatility-based)—to accommodate various trading styles and market conditions.
Unlike traditional fixed lines, this tool defines support and resistance as dynamic price zones, with thickness and breakout buffers scaled by Average True Range (ATR) to adapt to market volatility. It features zone merging and selective visibility options to manage overlapping zones, prioritizing recent or historical structures as needed.
The indicator applies multiple filters based on price re-tests, liquidity sweeps, traded volume, and zone duration to validate structural levels. Visual signals include arrows marking swing points, dots highlighting liquidity sweeps, crosses for migrated swings, and summary labels displaying entries, strength, sweeps, volume, and duration metrics.
A dashboard provides real-time statistics on active versus total structures, mitigation percentages, average zone duration, volume, and liquidity sweep counts. Users can customize detection methods, sensitivity, zone display styles, ATR parameters, overlap handling, and structural requirements. Alerts can be enabled for new or migrated support and resistance levels.
This toolkit supports detailed market structure analysis with data-driven, volatility-adjusted zones to assist traders in identifying key price areas.
インジケーターのプロフィール
インジケーターのカテゴリー
サポート&レジスタンス
出力の種類
ビジュアル表示
データ要件
バーのみ
サポート対象のシグナル
トレンドの強さ
カスタマーレビュー
0.0
レビュー: 0
カスタマーレビュー
この商品にはまだレビューがありません。お使いになったことがある方は、ぜひレビューをお願いします。
ディスカッション
よくあるご質問
Donchian Channels
Market Structure
Mitigation Block
ATR
Support & Resistance
cTrader Storeで入手可能な取引ボット、インジケーター、プラグインなどの商品は、第三者の開発者が提供するものであり、情報と技術の取得のみを目的としてご利用いただけます。cTrader Storeはブローカーではなく、投資助言や個人的な推奨を行うことも、将来のパフォーマンスを保証することもありません。
この作成者の他の商品


価格
38
販売
2.29K
無料インストール