
설명
MFI-MTF: 다중 시간대 머니 플로우 지수
개요
MFI-MTF는 현재 차트에 더 높은 시간대 관점을 제공하는 다중 시간대 모멘텀 지표입니다. 더 큰 시간대에서 머니 플로우 지수(MFI)를 계산하고 이를 작업 중인 차트에 표시함으로써, 이 지표는 시간대를 수동으로 전환하지 않고도 여러 시장 관점에서 과매수 및 과매도 상태를 식별하는 데 도움을 줍니다.
기능
머니 플로우 지수 분석: 이 지표는 가격 움직임과 거래량을 모두 분석하여 매수 및 매도 압력을 측정합니다. 0에서 100 사이를 진동하며, 자산이 과도한 매수(과매수) 또는 매도(과매도) 압력을 경험했을 때를 식별합니다.
상위 시간대 맥락: 현재 차트 시간대에서 MFI를 계산하는 대신, MFIMTF는 사용자가 지정한 더 큰 시간대(일간, 주간, 4시간 등)에서 데이터를 가져옵니다. 이를 통해 하위 시간대의 노이즈 없이 기관 수준의 모멘텀 통찰력을 얻을 수 있습니다. 예를 들어 일간 MFI가 과매수 상태를 나타내면, 더 큰 추세가 고갈에 이르고 있음을 알 수 있어 진입 및 청산 결정에 유용한 맥락을 제공합니다.
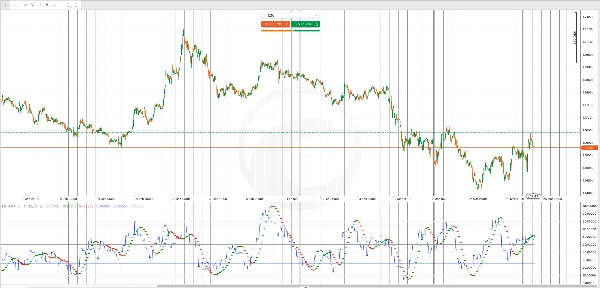
헐 이동평균 필터: MFI에 적용된 헐 이동평균(HMA)은 급격한 변동을 완화하고 방향성 모멘텀 변화를 강조합니다. 녹색 점은 모멘텀의 상승 추세를, 빨간 점은 하락 추세를 표시하여 모멘텀 방향 변화에 대한 빠른 시각적 확인을 제공합니다.
주요 출력값
MFI 라인(파란색): 선택한 상위 시간대에서 계산된 주요 머니 플로우 지수 값으로, 현재 차트의 모든 바에 표시됩니다.
HMA 신호(녹색/빨간 점): 모멘텀이 상승할 때 녹색 점이 나타나고, 모멘텀이 약해지거나 하락 반전할 때 빨간 점이 나타납니다. 이는 잠재적 전환에 대한 조기 경고 신호 역할을 합니다.
참조 수준:
- 과매수 수준(기본값 70): MFI가 이 수준을 초과하면 매수 압력이 과도하며 반전 가능성이 높아집니다
- 과매도 수준(기본값 30): MFI가 이 수준 아래로 떨어지면 매도 압력이 소진되어 반등 가능성이 높아집니다
- 중간선(50): 강세와 약세 모멘텀 사이의 중립 균형점
사용자 설정
시간대 선택: 현재 차트보다 높은 시간대를 선택하세요(예: 1시간 차트에서 일간). 더 큰 시간대는 더 넓은 추세 맥락을 제공하지만 신호 빈도는 적고, 더 작은 단위는 더 많은 거래 기회를 제공하지만 전략적 관점은 적습니다.
MFI 기간: 머니 플로우 지수의 조회 기간을 조정합니다(기본값 14). 짧은 기간은 최근 거래량 변화에 더 민감하게 반응하며, 긴 기간은 변동성을 완화하고 잘못된 신호를 줄입니다.
HMA 기간: 모멘텀 필터의 평활화를 제어합니다. 짧은 기간은 추세 변화를 더 명확하게 하지만 노이즈가 많고, 긴 기간은 추세를 더 신뢰성 있게 확인하지만 신호 생성이 느립니다.
과매수/과매도 임계값: 거래 스타일에 맞게 이 수준을 사용자 지정하세요. 보수적인 거래자는 75/25를, 공격적인 거래자는 80/20을 사용하여 더 극단적인 조건을 기다릴 수 있습니다.
실용적 사용법
MFI MTF를 사용하여 진입과 청산에 확신을 더하세요. 작업 중인 시간대에서 매도 신호가 발생했을 때 일간 MFI가 이미 과매수 상태라면 기관 매도자가 활동 중임을 나타내어 신뢰도가 높아집니다. 마찬가지로 상위 시간대 MFI가 과매도 상태일 때 매수 신호는 매도 압력이 거시적 수준에서 소진되었음을 보여 강해집니다.
HMA 색상 변화는 모멘텀 변화를 실시간으로 알려주어 손실 거래에서 조기 탈출하거나 반전이 심해지기 전에 포지션 크기를 줄이는 데 도움을 줍니다.
요약
The indicator includes a Hull Moving Average (HMA) filter applied to the MFI to smooth out noise and highlight momentum shifts. Green dots indicate strengthening upward momentum, while red dots signal weakening or downward momentum. Reference levels include default overbought (70), oversold (30), and a neutral midpoint (50), all customizable to fit different trading styles.
Key outputs are the MFI line from the chosen higher timeframe and HMA signals for momentum direction changes. Adjustable parameters include the MFI lookback period, HMA smoothing period, and overbought/oversold thresholds. MFI-MTF aids in confirming entry and exit points by providing institutional-level momentum insights and real-time alerts to momentum shifts on your working chart.
고객 리뷰
5 | 100 % | |
4 | 0 % | |
3 | 0 % | |
2 | 0 % | |
1 | 0 % |


