
설명
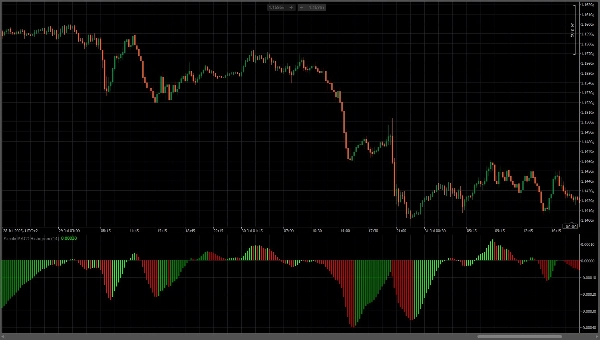
이 맞춤형 MACD 히스토그램 지표는 향상된 시각적 명확성 스타일로 MACD 히스토그램을 표시합니다. 이 지표는 빠른 EMA 기간을 14로 사용하며, 느린 EMA는 자동으로 빠른 EMA에 2를 더한 값(16)으로 계산합니다. 지표는 즉각적인 추세 인식을 위해 고대비 색상 코딩을 특징으로 합니다: 밝은 녹색 막대는 상승 모멘텀(강세)을 나타내고, 빨간 막대는 하락 모멘텀(약세)을 나타냅니다. 히스토그램 막대는 중앙의 0선에서 대칭적으로 확장되어, 녹색은 매수 압력을, 빨간색은 매도 압력을 직관적으로 시각화합니다. 이 시각화 스타일은 명확하고 모호하지 않은 모멘텀 신호를 제공하며, 가격 움직임에서 잠재적인 추세 반전과 모멘텀 변화를 식별하는 데 도움을 줍니다.
요약
AI 요약
The Simple MACD Histogram is a custom technical indicator designed to visually represent momentum in price action. It calculates a fast EMA with a period of 14 and a slow EMA set automatically to 16 (fast EMA plus 2). The histogram bars extend symmetrically from a zero line, with bright green bars indicating rising (bullish) momentum and red bars indicating falling (bearish) momentum. This color-coded display enhances clarity for quick trend recognition, helping users identify potential trend reversals and shifts in momentum. The indicator is intended for use in trading analysis to provide clear, unambiguous signals of buy and sell pressure.
지표 프로필
고객 리뷰
0.0
리뷰: 0
고객 리뷰
이 상품에 대한 리뷰가 아직 없습니다. 이미 사용해 보셨나요? 다른 사람들에게 가장 먼저 소개해 주세요!
상담
자주 묻는 질문(FAQ)
트레이딩 봇, 지표, 플러그인 등 cTrader Store에서 제공되는 상품은 제3자 개발자에 의해 제공되며, 이는 단순히 정보 및 기술적 접근을 목적으로 제공된 것입니다. cTrader Store는 중개인이 아니며, 투자 조언, 개인별 추천 또는 향후 성과에 대한 어떠한 보장도 제공하지 않습니다.


가격
가입일 15/06/2025
667
무료 설치