
Repiptor BB Colored Width
อินดิเคเตอร์
156 ดาวน์โหลด
เวอร์ชัน 1.0, Oct 2024
Windows, Mac
5.0
รีวิว: 1
คำอธิบาย
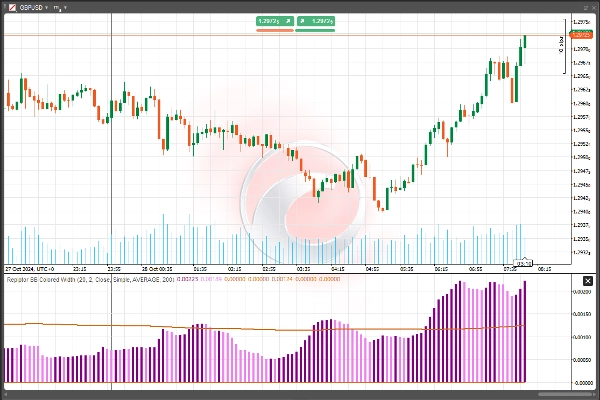
ความกว้างของแถบ Bollinger ที่มีสีสันพร้อมระดับไดนามิกสี่ระดับทางเลือก:
- ค่าเฉลี่ย
- มัธยฐาน
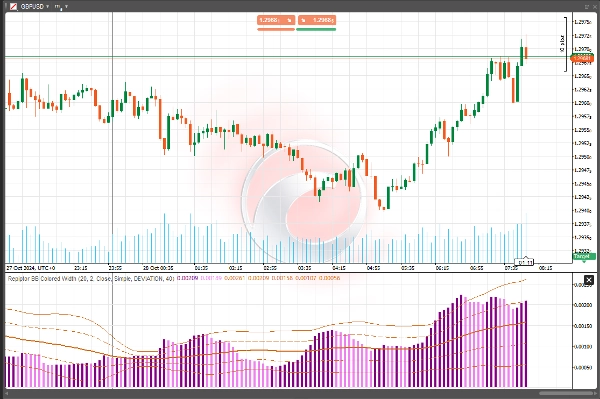
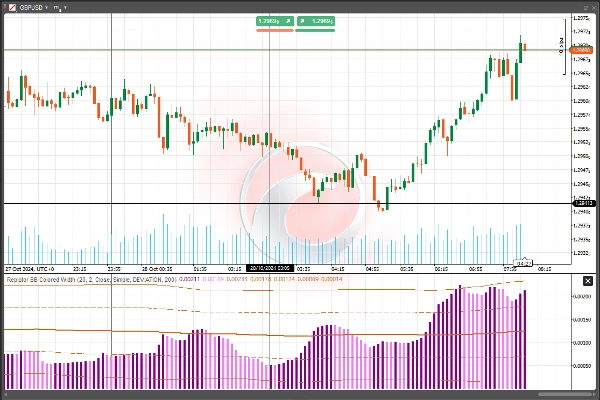
- ส่วนเบี่ยงเบน
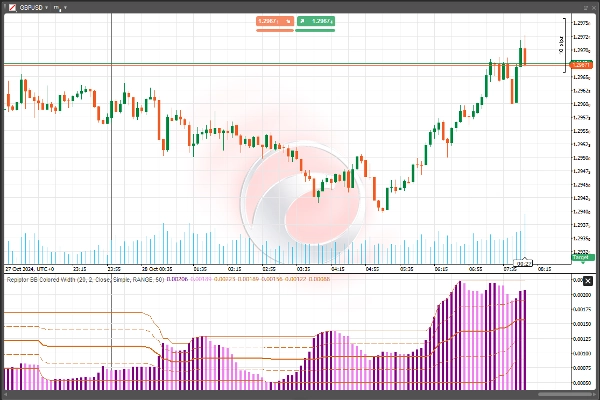
- ช่วง
สีเข้ม = ความผันผวนเพิ่มขึ้น, สีอ่อน = ความผันผวนลดลง
สรุป
สรุปโดย AI
Repiptor BB Colored Width is a technical indicator that visualizes the width of Bollinger Bands with color coding to represent volatility changes. It offers four dynamic measurement levels for the Bollinger Bands width: Average, Median, Deviation, and Range. The indicator uses color intensity to indicate volatility trends—darker colors signify increasing volatility, while lighter colors indicate decreasing volatility. This tool helps traders assess market volatility visually by highlighting changes in the Bollinger Bands width on their charts.
โปรไฟล์อินดิเคเตอร์
รีวิวจากลูกค้า
5.0
รีวิว: 1
5 | 100 % | |
4 | 0 % | |
3 | 0 % | |
2 | 0 % | |
1 | 0 % |
รีวิวจากลูกค้า
August 18, 2025
Clear volatility visualization, customizable, lightweight. Cons: No alerts, no MTF mode, lacks integrated breakout signals.
การสนทนา
คำถามที่พบบ่อย
Bollinger
ผลิตภัณฑ์ที่มีให้บริการผ่าน cTrader Store รวมถึงบอทการเทรด อินดิเคเตอร์ และปลั๊กอิน มีให้บริการโดยนักพัฒนาบุคคลที่สามและมีไว้เพื่อวัตถุประสงค์ในการเข้าถึงข้อมูลและทางเทคนิคเท่านั้น cTrader Store ไม่ใช่โบรกเกอร์และไม่ได้ให้คำแนะนำการลงทุน คำแนะนำส่วนบุคคล หรือการรับประกันผลการดำเนินงานในอนาคต
เพิ่มเติมจากผู้เขียนคนนี้


ราคา
ตั้งแต่ 26/10/2024
1.19K
ติดตั้งฟรี