
Candle Count
지표
232 다운로드
버전 1.0, Oct 2025
Windows, Mac
설명
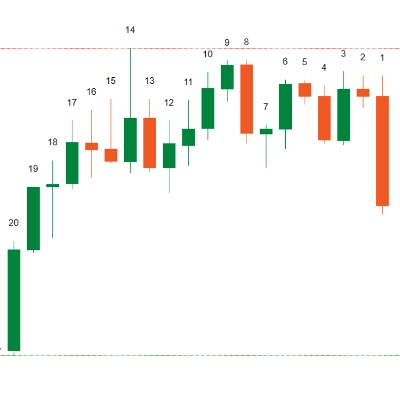
캔들 카운터 지표는 차트를 분석할 때 정확한 제어와 명확성을 원하는 트레이더를 위한 간단하면서도 강력한 시각적 도구입니다.
각 캔들을 순서대로 자동으로 라벨링합니다 — 1, 2, 3, 4... — 특정 시간이나 이벤트 이후 몇 개의 바가 형성되었는지 추적할 수 있습니다. 이는 교육 목적, 시장 타이밍 연구 또는 캔들 기반 주기에 의존하는 전략에 특히 유용합니다.
카운터가 리셋되는 시점을 선택할 수 있습니다:
- 자정에 (Forex나 암호화폐 같은 24시간 자산의 경우)
- 세션 시작 시 (예: XAUUSD는 19:00에 재개장)
- 시간 간격 후 (거래가 중단되는 주식이나 자산의 경우)
조절 가능한 텍스트 색상, 글꼴 크기 및 위치 설정으로 캔들 카운터는 모든 시장에 적응합니다 — Forex, 주식, 지수 또는 암호화폐.
이 지표의 목적은 신호를 생성하는 것이 아니라 차트 읽기를 더 깔끔하고 구조화되게 만들어 — 언제든지 캔들 시퀀스에서 정확히 어디에 있는지 이해하는 데 도움을 주는 것입니다.
요약
AI 요약
The Candle Count indicator sequentially labels each candle on a trading chart with numbers (1, 2, 3, etc.), providing a clear visual reference for tracking the number of bars formed since a specific time or event. Users can customize when the count resets, choosing from options such as midnight (suitable for 24-hour markets like Forex or cryptocurrencies), session open times (e.g., for XAUUSD), or after trading gaps (common in stocks). The indicator supports adjustable text color, font size, and label positioning to fit various chart styles. It is compatible with multiple markets including Forex, stocks, indices, commodities, and cryptocurrencies. This tool is designed to enhance chart readability and structure, aiding traders in understanding their position within candle sequences without generating trading signals.
지표 프로필
고객 리뷰
0.0
리뷰: 0
고객 리뷰
이 상품에 대한 리뷰가 아직 없습니다. 이미 사용해 보셨나요? 다른 사람들에게 가장 먼저 소개해 주세요!
상담
자주 묻는 질문(FAQ)
BTCUSD
Forex
Indices
EURUSD
Commodities
GBPUSD
NZDUSD
Prop
Crypto
Stocks
XAUUSD
NAS100
USDJPY
트레이딩 봇, 지표, 플러그인 등 cTrader Store에서 제공되는 상품은 제3자 개발자에 의해 제공되며, 이는 단순히 정보 및 기술적 접근을 목적으로 제공된 것입니다. cTrader Store는 중개인이 아니며, 투자 조언, 개인별 추천 또는 향후 성과에 대한 어떠한 보장도 제공하지 않습니다.
이 작성자의 상품 더 보기


가격
가입일 11/10/2025
2.55M
거래량
17.52K
핍 수익
1
판매
232
무료 설치