
설명
TECHNICAL ANALYSIS 지표는 강력한 추세, 시장 모멘텀 및 거래량 확인을 식별하는 데 중점을 둔 여러 기술 지표를 통합하여 cAlgo 플랫폼용으로 개발된 고급 기술 분석 솔루션입니다. ADX(평균 방향성 지수)를 기울기 분석, 거래량 필터링 및 실시간 다중 지표 기술 분석과 결합하여 트레이더에게 의사 결정에 필요한 포괄적이고 신뢰할 수 있는 시각을 제공합니다.
🔍 주요 전략
1. 기본: ADX + DI (방향성 이동 시스템)
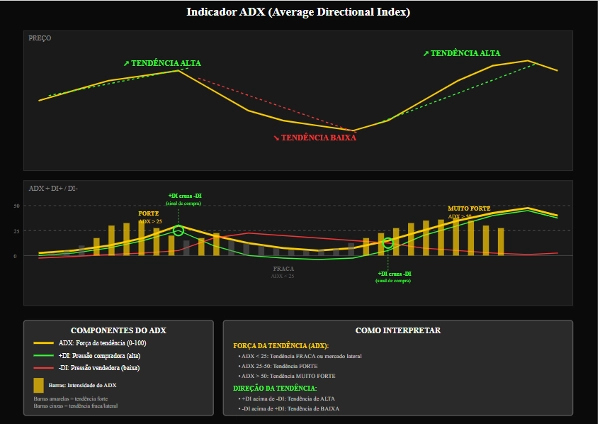
지표의 핵심은 추세의 강도를 측정하는 ADX(평균 방향성 지수)입니다.
+DI(양의 방향성 지표)와 -DI(음의 방향성 지표) 구성 요소는 추세의 방향을 식별합니다:
+DI > -DI → 상승 추세
-DI > +DI → 하락 추세
2. 기울기를 이용한 동적 모멘텀 분석
ADX, +DI 및 -DI의 기울기는 선형 회귀를 사용하여 계산됩니다.
이를 통해 추세가 다음 중 어느 것인지 식별할 수 있습니다:
강해지고 있음 (양의 기울기)
약해지고 있음 (음의 기울기)
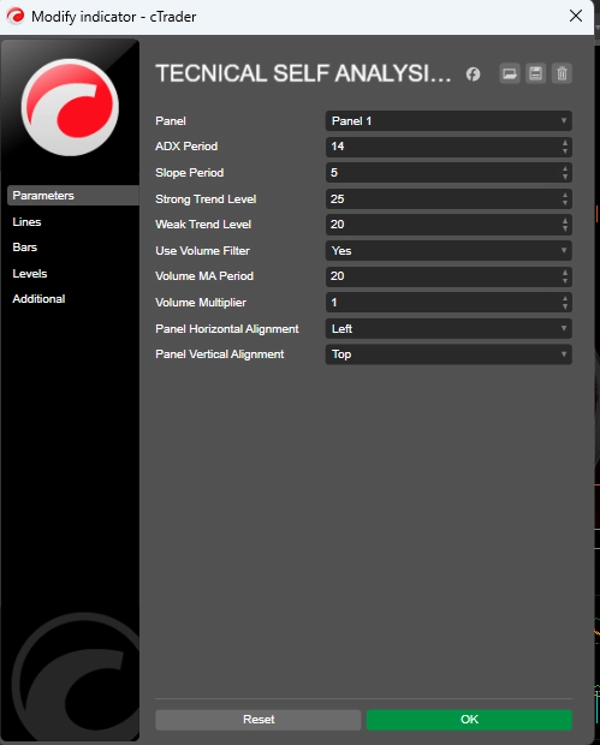
3. 기준 레벨
강한 추세 레벨: 추세가 강하다고 간주되는 레벨 이상 (기본값: 25)
약한 추세 레벨: 유효한 추세로 간주되는 최소 레벨 (기본값: 20)
약한 레벨 이하의 추세는 횡보 또는 명확한 방향이 없는 것으로 처리됩니다.
📈 신호 생성
매수 조건
✅ +DI가 -DI를 상향 돌파
✅ ADX가 약한 추세 레벨 이상 (약한 추세 레벨)
✅ ADX 및 +DI 기울기가 양수
✅ 거래량 확인 (선택 사항)
매도 조건
✅ -DI가 +DI를 상향 돌파
✅ ADX가 약한 추세 레벨 이상 (약한 추세 레벨)
✅ ADX 및 -DI 기울기가 양수
✅ 거래량 확인 (선택 사항)
강력한 신호: ADX가 강한 추세 레벨 이상이고 기울기가 상당히 양수일 때, 지표는 강화된 신호를 생성하며 연속적인 반복 진입을 피합니다. 📊 거래량 필터 (선택 사항)
지표는 신호를 생성하기 전에 거래량 확인이 필요할 수 있습니다.
현재 거래량은 거래량 이동 평균 × 배수보다 크거나 같아야 합니다.
이는 유동성이 낮은 시장에서의 거짓 돌파 및 신호를 걸러내는 데 도움이 됩니다.
🧠 고급 기술 분석 (인터랙티브 패널)
TECHNICAL ANALYSIS는 차트에 두 개의 인터랙티브 패널을 포함합니다:
1. 추세 정보
추세 유형: 상승 / 하락 / 횡보
추세 강도: 강함 / 약함
모멘텀: 강화 / 약화 / 안정
현재 ADX, +DI, -DI 및 기울기 값
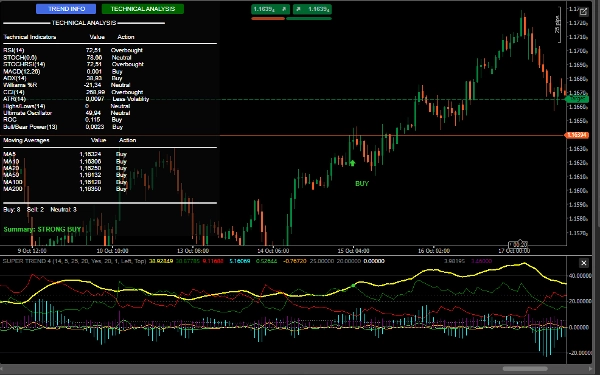
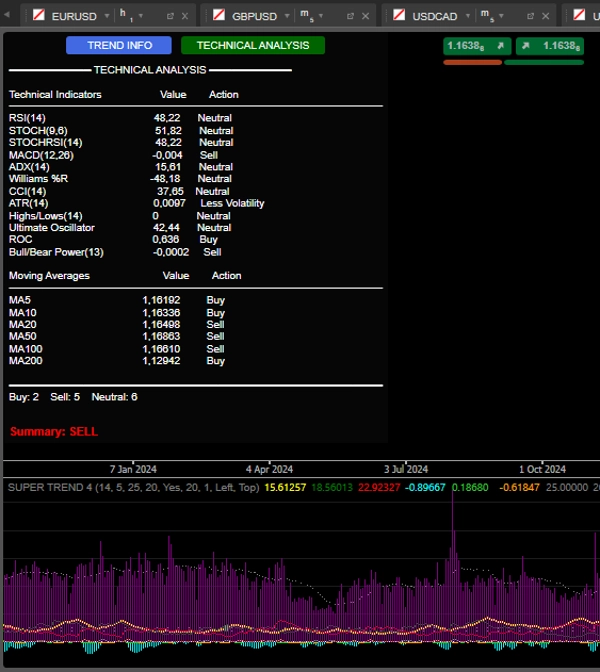
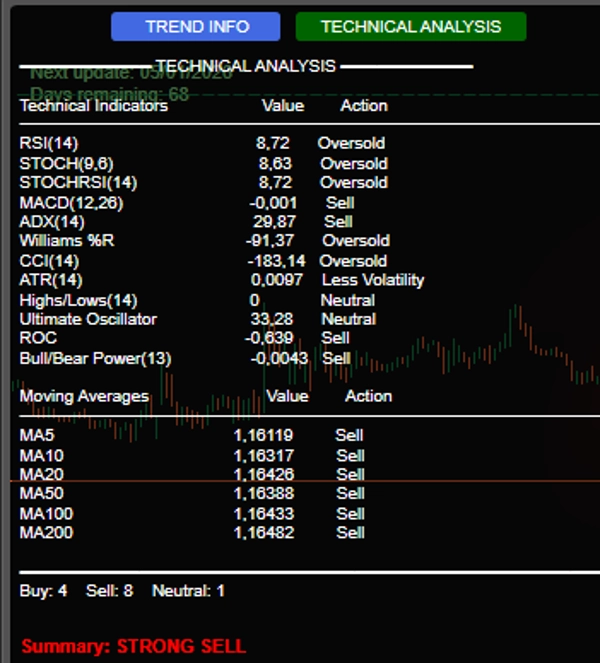
2. 기술 분석
다음 지표를 포함한 실시간 다중 지표 분석을 수행합니다:
RSI(14) – 과매수/과매도
스토캐스틱(14) – 모멘텀
MACD(12,26) – 교차 및 다이버전스
Williams %R – 시장 극단
CCI(14) – 전형적인 가격에서의 편차
ROC(12) – 변화율
Ultimate Oscillator – 강도 확인
Bull/Bear Power – 매수/매도 압력
이동 평균 (5,10,20,50,100,200) – 장기 추세
최종 요약: 시스템은 매수/매도/중립 신호를 집계하여 명확한 권고를 제공합니다:
강력 매수 (≥7 매수 신호)
매수
매도
강력 매도 (≥7 매도 신호)
중립
🔔 알림 및 시각화
차트상의 시각적 신호:
"BUY"/"SELL" 라벨이 있는 녹색/빨간색 화살표
사운드 알림 (Windows)
콘솔에 자세한 로그 포함:
신호 시간
ADX, DI 및 거래량 값 (활성화된 경우)
🛡️ 경쟁 우위
✅ 단일 패널에 여러 지표 통합
✅ 추세의 강도와 방향에 집중 (단순 가격이 아님)
✅ 신뢰성 향상을 위한 거래량 필터
✅ 인터랙티브하고 정보 제공이 풍부한 인터페이스
✅ 시각 및 음성 알림이 포함된 명확한 신호
이것은 테스트 버전입니다.


