

Deskripsi
Rata-rata bergerak berbasis efisiensi yang menyesuaikan kecepatan perataan secara dinamis berdasarkan kondisi pasar.
Menghitung perataan melalui Rasio Efisiensi (pergerakan arah vs. volatilitas total), merespons dengan cepat dalam tren dan meratakan saat terjadi noise untuk menghindari sinyal palsu.
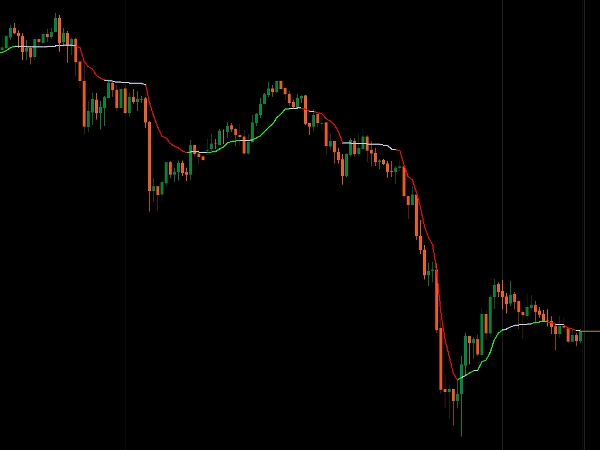
Visualisasi warna tiga keadaan (Hijau tren naik, Merah tren turun, Biru Muda sideway), parameter sensitivitas yang dapat dikonfigurasi (Periode, Perataan Cepat/Lambat, ambang ER), pergantian otomatis antara mode cepat dan lambat, serta perilaku support/resistance dinamis memberikan pelacakan tren adaptif bagi trader yang membutuhkan responsivitas di pasar arah dan stabilitas selama konsolidasi.
FITUR
Algoritma Adaptif
- Kecepatan perataan berubah berdasarkan Rasio Efisiensi (ER)—rasio pergerakan arah terhadap volatilitas total
- Merespons cepat saat efisiensi meningkat
- Meratakan saat harga berisik untuk menghindari sinyal palsu
- Jarak dinamis dari harga berdasarkan perilaku pasar
Visualisasi Tiga Keadaan
- Hijau: Tren naik kuat (ER di atas ambang + naik)
- Merah: Tren turun kuat (ER di atas ambang + turun)
- Biru Muda: Sideway/berombak (ER di bawah ambang)
- Konfirmasi visual instan kondisi pasar
Sensitivitas yang Dapat Dikustomisasi
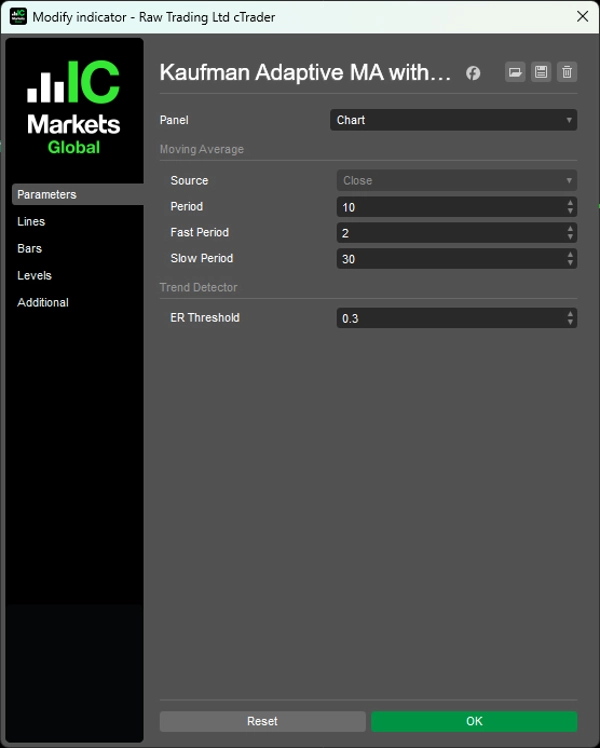
- Periode: Jangka waktu untuk perhitungan efisiensi (default: 10)
- Periode Cepat: Perataan dalam tren kuat (default: 2)
- Periode Lambat: Perataan dalam pasar sideway (default: 30)
- Ambang ER: Efisiensi minimum untuk dikategorikan sebagai tren (default: 0.3)
Adaptasi Cerdas
- Berpindah otomatis antara perataan cepat dan lambat
- Menyaring noise di pasar yang berombak
- Menangkap tren lebih awal saat kondisi berubah
- Berfungsi sebagai support/resistance dinamis
__________________________________________________________________________________________
INDIKATOR GRATIS LAINNYA
Jelajahi berbagai alat analisis pasar—dari struktur dan volume hingga regresi, volatilitas, dan kerangka waktu kustom.
Kode sumber tersedia di repository GitHub.
Semua gratis untuk digunakan. Namun jika Anda ingin memberikan dukungan kopi, Anda dapat mengirimkannya di sini.
Support/Resistance
Volume
- Volume Activity Profiler
- Volume Efficiency Analyzer
- Volume Profile Analytics
- Volume Profile - Updated
- Volume Spread Analysis
- VWAP (Volume Weighted Average Price)
Moving Averages
- SSL Channel
- Anchored Moving Average
- Deviation-Scaled Moving Average
- Gann High Low Activator
- Instantaneous Trendline
- Kaufman Adaptive MA with Trend Vision
- Moving Average Channel
- Moving Averages Suite
- Trend Channel Moving Average
Utilities/Custom
Berbasis Regresi
Volatilitas
Osilator
__________________________________________________________________________________________
PENAFIAN
Perdagangan melibatkan risiko. Indikator ini hanya untuk analisis teknikal — selalu terapkan manajemen risiko yang tepat dan berdagang dengan bertanggung jawab.
MASUKAN & PENINGKATAN
Jika Anda memiliki saran, permintaan fitur, atau ide untuk peningkatan, silakan tinggalkan komentar di tab Diskusi. Masukan Anda membantu meningkatkan indikator untuk semua orang.
Ringkasan
Key features include a three-state color-coded visualization: green for strong uptrends, red for strong downtrends, and light blue for ranging or choppy markets, providing immediate visual insight into market states. Users can configure sensitivity parameters such as lookback period, fast and slow smoothing periods, and the ER threshold to tailor responsiveness.
The indicator automatically switches between fast and slow smoothing modes, adapting to changing market behavior. It also acts as a dynamic support and resistance tool, helping traders identify trend shifts early while filtering out noise in consolidation phases. This adaptive approach supports scalping and other trading strategies requiring both responsiveness and stability in directional and ranging markets.
Ulasan pelanggan
Diskusi
Pertanyaan umum
Produk lain dari penulis ini

























Harga