
설명
일일 TPO 프로필
각 세션에 대해 POC, VAH 및 VAL을 계산하는 일일 TPO 프로필 지표입니다.
차트에 직접 제어점(Point of Control)과 70% 가치 영역(Value Area)을 표시하여 공정 가치 구역, 주요 지지/저항 수준 및 가격 거부 또는 수용 가능성이 있는 영역을 식별하는 데 도움을 줍니다.
작동 방식
이 지표는 시장 프로필과 유사한 일일 TPO(시간 가격 기회) 프로필을 구축합니다.
거래일의 각 바에 대해 다음을 수행합니다:
- 가격 축을 “행 크기(핍)”로 정의된 고정 “단계”로 분할합니다.
- 각 가격 단계마다 해당 수준에 닿은 바의 수를 계산합니다 (TPO = 가격이 거래된 횟수)
- 하루가 끝나면 다음을 계산합니다:
-
- POC (제어점) → 가장 많은 TPO가 있는 가격 수준 (시장이 가장 오래 머문 곳)
- VAH (가치 영역 상단) 및 VAL (가치 영역 하단) → 해당 세션의 모든 TPO 중 약 가치 영역 %(기본값 70%)를 포함하는 가격 수준
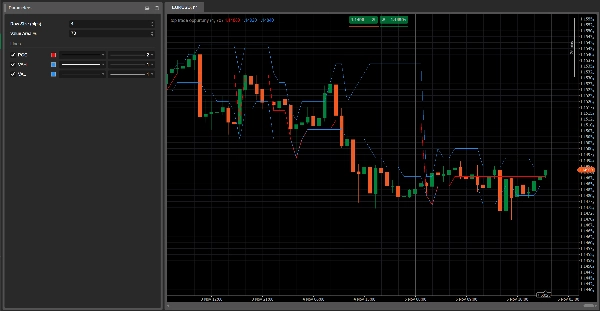
이 지표는 차트에 세 개의 수평선을 표시합니다:
- 빨간선 → POC
- 파란선 → VAH (상단) 및 VAL (하단)
이 선들은 세션 동안 바 단위로 업데이트되며 새로운 거래일이 시작되면 초기화됩니다.
주요 매개변수
행 크기(핍)
프로필에서 각 가격 단계의 두께를 정의합니다.-
- 값이 작을수록 더 세밀한 프로필
- 값이 클수록 더 부드러운 프로필
가치 영역 %
가치 영역 내에 포함된 전체 TPO의 백분율 (일반적으로 70%).
가치 영역은 하루 동안 시장 활동이 가장 많이 발생한 가격 구역입니다.
읽는 방법
- POC (빨간선)
-
- 그날 시장에서 가장 “수용된” 가격 수준입니다.
- 종종 균형 수준으로 작용하며: 가격이 이 구역에서 반등, 정체 또는 강한 돌파를 할 수 있습니다.
- 가치 영역 (VAH–VAL, 파란선)
-
- 대부분의 거래가 이루어진 “공정 가치” 구역을 나타냅니다.
- VAH/VAL에 대한 가격 움직임은 다음을 보여줄 수 있습니다:
-
- 거부 (VAH/VAL을 넘는 가짜 돌파)
- 수용 (가치 영역 밖에서의 통합)
일반적인 사용 아이디어
- 가격이 VAL을 거부하고 가치 영역 안으로 다시 진입 → “공정 가치”(평균 회귀)로의 복귀를 기대하는 잠재적 매수 아이디어.
- 가격이 강하게 VAH를 돌파하고 그 위에서 구조를 형성하기 시작 → 새로운 더 높은 가치 영역의 잠재적 시작 (추세 추종 시나리오).
- 여러 날 동안 POC가 같은 수준 근처에 위치 → 강한 균형/축적 구역, 종종 주요 지지/저항.
요약
AI 요약
The Daily TPO Profile indicator constructs a daily Time Price Opportunity (TPO) profile similar to a Market Profile, analyzing market activity by price levels throughout each trading session. It divides the price axis into fixed increments ("Row Size" in pips) and counts how many bars traded at each price step, representing TPOs. At the end of the session, it calculates three key levels: the Point of Control (POC), where the market spent the most time; the Value Area High (VAH); and the Value Area Low (VAL), which together define the price range containing approximately 70% of the trading activity.
The indicator plots these levels as horizontal lines on the chart—POC in red, VAH and VAL in blue—updating them bar by bar during the session and resetting daily. Traders use the POC as an equilibrium price level that may act as support or resistance. The Value Area highlights fair value zones, with price action near VAH and VAL signaling potential rejection or acceptance of price extremes. Typical applications include identifying mean reversion opportunities when price rejects VAL or trend-following setups when price breaks above VAH.
Main adjustable parameters include Row Size (pips), controlling profile detail, and Value Area %, defining the percentage of TPOs included in the value area. The indicator supports analysis across various markets including forex, indices, commodities, stocks, and cryptocurrencies.
지표 프로필
고객 리뷰
0.0
리뷰: 0
고객 리뷰
이 상품에 대한 리뷰가 아직 없습니다. 이미 사용해 보셨나요? 다른 사람들에게 가장 먼저 소개해 주세요!
상담
자주 묻는 질문(FAQ)
Signal
Indices
Commodities
GBPUSD
RSI
Bollinger
Fibonacci
Scalping
AI
XAUUSD
NAS100
MACD
BTCUSD
Forex
Breakout
EURUSD
NZDUSD
Martingale
Prop
ZigZag
Supertrend
Fair Value Gap
SMC
Crypto
Grid
Stocks
ATR
USDJPY
VWAP
트레이딩 봇, 지표, 플러그인 등 cTrader Store에서 제공되는 상품은 제3자 개발자에 의해 제공되며, 이는 단순히 정보 및 기술적 접근을 목적으로 제공된 것입니다. cTrader Store는 중개인이 아니며, 투자 조언, 개인별 추천 또는 향후 성과에 대한 어떠한 보장도 제공하지 않습니다.


가격
42.11M
거래량
6.13M
핍 수익
224
판매
8.41K
무료 설치