설명
스마트 머니 개념 — 고수준 개요
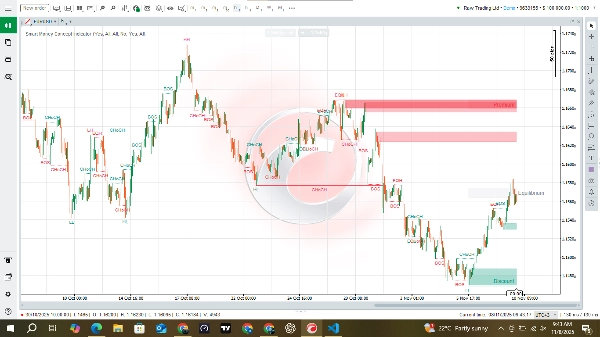
스마트 머니 개념은 전문적/기관 활동이 가격에 영향을 미쳤을 가능성이 있는 위치를 시각화합니다. 시장 구조(스윙 및 단기 구조)를 자동으로 식별하고, 구조 붕괴(BOS)와 성격 변화(CHoCH)를 강조하며, 동일 고점/저점을 찾고, 후보 주문 블록 범위(큰 플레이어가 주문을 넣었을 가능성이 있는 영역)를 포착하며, 맥락 구역(프리미엄, 균형, 할인)을 표시합니다. 시장 변동성에 적응하여 해당 도구의 현재 활동에 맞게 임계값이 조정됩니다.
트레이더가 한눈에 얻는 것
- 구조가 전환되거나 깨질 때를 명확히 보여주는 라벨(편향을 판단하는 데 도움).
- 강조된 주문 블록 영역 — 가격이 자주 재시험하는 잠재적 공급/수요 구역.
- 동일 고점/저점 표시기 — 스톱 헌팅이나 재시험을 위한 유동성 노드 가능성.
- 맥락 구역 — 프리미엄(비쌈), 균형(공정 가치), 할인(저렴함) — 편향과 목표에 유용.
- 최근 중요한 극단을 보여주는 강한/약한 고점 및 저점 추적.
SMC 트레이더에게 유용한 이유
- 레벨 식별 속도 향상: 피벗과 주문 블록을 수동으로 찾지 않아도 되도록 레벨을 그리고 저장합니다.
- 일관성: 동일한 규칙을 적용하여 다양한 도구와 시간대에서 구조 전환과 주문 블록 후보를 식별합니다.
- 맥락적 진입: 기관의 관심이 있을 수 있는 위치를 보여주어, 추측 대신 해당 영역의 재시험에서 진입 계획을 세울 수 있습니다.
- 리스크 프레이밍: 구역과 주문 블록 경계는 스톱과 목표 설정에 논리적인 위치를 제공합니다(예: 주문 블록 저점/고점 너머에 스톱 설정).
- 다중 규모 워크플로우: 편향을 위해 더 큰 규모 구조를 사용하고, 정밀한 진입을 위해 더 작은 내부 구조를 사용합니다.
주요 요소 해석 방법
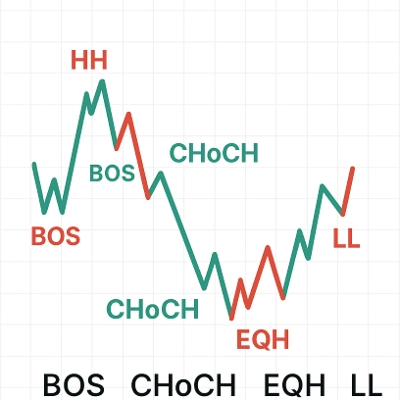
- BOS (Break of Structure) — 붕괴 방향으로의 지속 신호; 추세 확인에 유용합니다.
- CHoCH (Change of Character) — 시장 행동이 전환될 수 있음을 나타냄; 잠재적 반전 또는 편향 변화로 간주합니다.
- 주문 블록(OBs) — 큰 주문이 축적되었을 가능성이 있는 가격 범위; 재시험과 거절이 예상됩니다.
- 동일 고점/저점 — 유동성이 축적되는 반복된 레벨; 큰 움직임 전에 자주 목표가 됩니다.
- 프리미엄/균형/할인 — 단순한 가치 지도: 프리미엄은 판매자에 유리, 할인은 구매자에 유리, 균형은 중립/평균입니다.
요약
지표 프로필
고객 리뷰
0.0
리뷰: 0
고객 리뷰
이 상품에 대한 리뷰가 아직 없습니다. 이미 사용해 보셨나요? 다른 사람들에게 가장 먼저 소개해 주세요!
상담
자주 묻는 질문(FAQ)
BTCUSD
Forex
Indices
EURUSD
Commodities
GBPUSD
Prop
SMC
Crypto
Stocks
XAUUSD
NAS100
USDJPY
트레이딩 봇, 지표, 플러그인 등 cTrader Store에서 제공되는 상품은 제3자 개발자에 의해 제공되며, 이는 단순히 정보 및 기술적 접근을 목적으로 제공된 것입니다. cTrader Store는 중개인이 아니며, 투자 조언, 개인별 추천 또는 향후 성과에 대한 어떠한 보장도 제공하지 않습니다.
이 작성자의 상품 더 보기


가격
가입일 14/06/2025
1
판매