설명
📈 Skew 변동성 편향 지표 – 전문가 버전 (cTrader용)
시장 압력, 변동성 불균형 및 방향성 확신에 대한 더 깊은 이해를 제공하는 Skew 변동성 편향 지표는 원래 Pine Script에서 영감을 받은 고전적인 변동성 기반 접근법의 향상된 버전으로, 이제 cTrader에 완벽하게 최적화되었습니다.
이 도구는 트레이더가 시장 어느 쪽이 더 강하게 작용하는지— 매수자 또는 매도자 — 변동성 비대칭을 측정하고 이를 명확하고 읽기 쉬운 신호로 변환하여 시각화하는 데 도움을 줍니다.
지수, 외환, 원자재 또는 암호화폐를 거래하든 이 지표는 강력한 추세 필터, 체제 감지기 및 편향 확인 도구로 작동합니다.
1. Skew 지표가 측정하는 것
이 지표는 강세 및 약세 캔들 간의 변동성 균형을 평가합니다.
정규화된 True Range를 계산하여 두 개의 적응 평균에 입력합니다:
- Deviation Max → 상승 캔들 동안 발생한 변동성
- Deviation Min → 하락 캔들 동안 발생한 변동성
그런 다음 다음을 계산합니다:
👉 Skew = DeviationMax / DeviationMin
이것은 원시 변동성을 명확한 방향성 판독값으로 변환합니다:
- Skew > 1 → 평균적으로 상승 움직임이 더 강함
- Skew < 1 → 하락 움직임이 더 강함
- Skew ≈ 1 → 변동성이 대칭적이며 시장이 균형 상태임
요약하면:
Skew는 어느 쪽이 “변동성 우위”를 가지는지 보여줍니다.
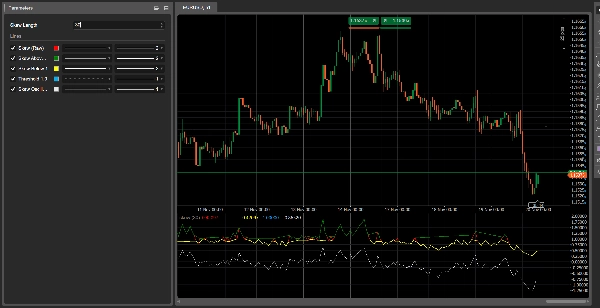
2. 선의 이해
1. Skew (원시) – 빨간 선
순수 변동성 비율입니다. 이것이 핵심 신호입니다.
2. Skew 1 이상 – 초록 선
강세 변동성 우위를 나타냅니다.
3. Skew 1 이하 – 노란 선
약세 변동성 우위를 나타냅니다.
4. 임계값 1.0 선 – 파란 점선
균형을 나타냅니다.
5. Skew 오실레이터 (로그) – 흰색 선
더 안정적이고 부드러운 표현:
- 0 이상 = 강세 변동성
- 0 이하 = 약세 변동성
3. 읽는 방법
A) 시장 체제
🔹 강세 체제
- Skew > 1
- 초록 선 활성
- 오실레이터 0 이상
→ 시장은 롱 포지션을 선호합니다.
🔹 약세 체제
- Skew < 1
- 노란 선 활성
- 오실레이터 0 이하
→ 시장은 숏 포지션을 선호합니다.
🔹 중립
- Skew ≈ 1
→ 시장이 균형을 이루며, 범위 거래에 적합합니다.
4. 체제 전환 신호
Skew가 1 이상으로 교차할 때
→ 매수자가 변동성 우위를 차지함
→ 강세 전환
Skew가 1 이하로 교차할 때
→ 매도자가 변동성 우위를 차지함
→ 약세 전환
이러한 전환은 종종 가격 움직임이 추세를 확인하기 전에 발생하여 Skew를 강력한 조기 지표로 만듭니다.
5. 실용적인 사용 사례
1️⃣ cBots용 추세 필터
- SkewOsc > 0일 때만 롱 거래
- SkewOsc < 0일 때만 숏 거래
2️⃣ 추세 품질 확인
- 상승 추세 + Skew > 1 = 강한 추세
- 상승 추세 + Skew가 1로 하락 = 추세 약화
3️⃣ 시장 심리 / 리스크 필터
특히 지수 및 주요 FX 통화쌍에서 효과적입니다.
6. 요약
- 보여주는 것: 변동성 우위
- 중요한 이유: 변동성 변화가 가격 변화를 앞섬
- 사용 방법: 필터, 확인 도구 또는 심리 측정기로 활용
- 최고의 장점: 매우 가볍고 빠르며 적응력이 뛰어남
요약
고객 리뷰
5 | 67 % | |
4 | 33 % | |
3 | 0 % | |
2 | 0 % | |
1 | 0 % |


