Beschreibung
📊 Trading Pro Market
https://chartshots.spotware.com/c/69f0ec41d4cfc
Trendkanal + Preisprognose + automatische Unterstützungs- & Widerstandsbereiche — alles in einem Overlay-Indikator
🔍 Was ist das?
https://chartshots.spotware.com/c/69f0ec1fa9930
Trading Pro Market ist ein fortschrittlicher technischer Analyseindikator, der drei unabhängige Engines in einem einzigen Tool kombiniert: einen Trendkanal mit Vorwärtsprojektion, ein Preisprognosesystem basierend auf historischen Bewegungsmustern und einen automatischen Unterstützungs- & Widerstandsbereichsdetektor. Alles wird direkt im Preischart dargestellt — kein separates Panel erforderlich.
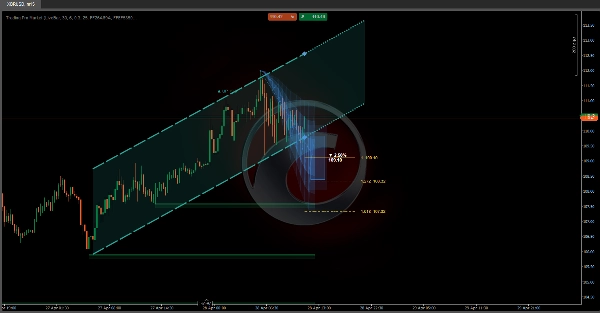
📐 Modul 1 →ICP Kanal🔮 Modul 2 → MFP Prognose 🧲 Modul 3 → S/R Zonen
https://chartshots.spotware.com/c/69f0ec8faa957
📐 Modul 1 — Trendkanal (ICP)
⚙️ Wie erkennt er den Trend?
Der Indikator teilt die sichtbaren Balken in Zeitblöcke auf (Standard: 30 Balken pro Block, insgesamt 6 Blöcke). Innerhalb jedes Blocks berechnet er den geometrischen Mittelpunkt zwischen dem höchsten Hoch und dem niedrigsten Tief unter Verwendung einer logarithmischen Preisskala. Diese Mittelpunkte werden dann über die Blöcke hinweg verbunden, um zu bestimmen, ob der Preis steigt, fällt oder seitwärts verläuft.
Die Steigung dieser Verbindungslinie wird in einen Winkel in Grad umgerechnet. Fällt der Winkel unter den konfigurierten Schwellenwert (Standard 0,3°), wird der Markt als seitwärts tendierend klassifiziert. Liegt der Winkel darüber, weist der Indikator eine bullische oder bärische Richtung zu.
💡 Die Volatilität wird mit dem Yang-Zhang-Schätzer gemessen — eine statistische Formel, die Open, Close, High und Low Preise verwendet, um die tatsächliche Marktvolatilität zu berechnen. Diese Zahl normalisiert die Winkel, sodass sich der Kanal bei jedem Asset oder Zeitrahmen konsistent verhält.
🎨 Was zeichnet er im Chart?
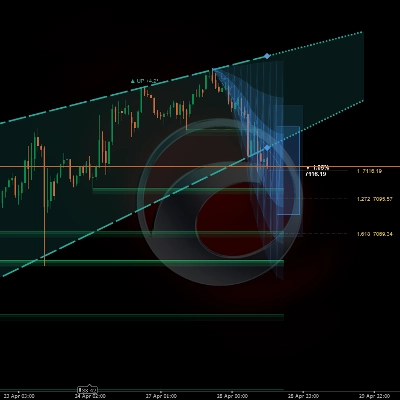
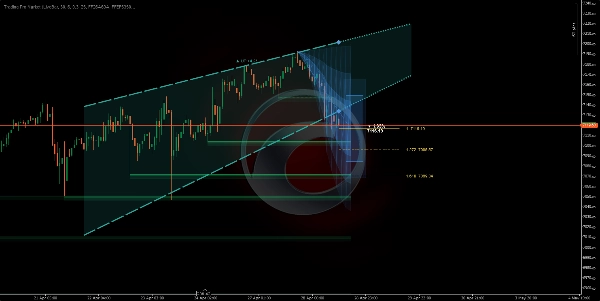
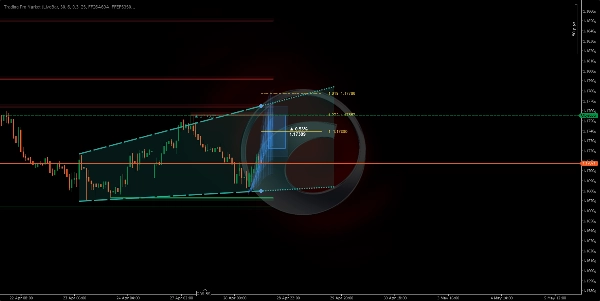
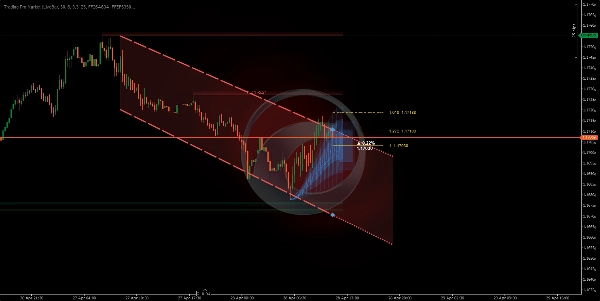
Er zeichnet zwei Linien, die den Kanal bilden (Decke und Boden), mit einer schattierten Füllzone dazwischen. Rechts wird der Kanal als gepunktete Projektion entsprechend der aktuellen Steigung verlängert. Die Farben ändern sich automatisch je nach Richtung:
🟢 Grün — bullischer Trend🔴 Rot — bärischer Trend⬜ Grau — Seitwärtsmarkt
🔁 Zustandsmaschine — wo befindet sich der Preis im Kanal?
Der Indikator verfolgt die Echtzeitposition des Schlusskurses relativ zu den Kanalgrenzen und klassifiziert die Situation in fünf verschiedene Zustände:
🟦 Innen→⚡ Ausbruch→📏 Abstand→↩️ Retest→✅ Bestätigt
Jeder Zustand wird im Info-Panel des Charts in Klartext beschrieben, zusammen mit dem prozentualen Abstand zur Kanaldecke oder zum Boden zu jedem Zeitpunkt.
🔮 Modul 2 — Bewegungsprognose (MFP)
⚙️ Wie erzeugt er die Prognose?
Die Engine erkennt signifikante Preiswendepunkte (lokale Hochs und Tiefs), indem sie eine konfigurierbare Anzahl von Balken zurückblickt. Jeder bestätigte Wendepunkt speichert zwei Datenpunkte: den Prozentsatz der abgeschlossenen Preisbewegung und die Anzahl der dafür benötigten Balken. Bis zu 20 historische Bewegungen werden gespeichert, und die erwartete nächste Bewegung wird mit einer von drei Methoden berechnet:
⚖️ Gewichtet — neuere Bewegungen haben mehr Gewicht➕ Einfacher Durchschnitt — alle Bewegungen gleich gewichtet📊 Median — Ausreißer werden herausgefiltert
🎨 Was zeichnet er im Chart?
Drei optionale visuelle Elemente werden basierend auf dem aktuellen Wendepunktursprung in die Zukunft projiziert:
1
🔵 Projektionszone: drei Schichten mit abnehmender Deckkraft, die den wahrscheinlichen Bewegungsbereich darstellen. Ein breiterer Kegel bedeutet größere Unsicherheit basierend auf der historischen Varianz.
2
🎯 Zielbox: ein Rechteck, das am geschätzten Zielpreis platziert wird, mit dem erwarteten prozentualen Bewegungsumfang und dem genauen Preisniveau als Beschriftung.
3
📏 Fibonacci-Niveaus: horizontale Linien, die vom Ursprung zum Ziel mit konfigurierbaren Verhältnissen projiziert werden (Standard: 1.0, 1.272, und 1.618).
⚠️ Die Prognose sagt die Zukunft nicht voraus. Sie ist ein statistischer Durchschnitt vergangener ähnlicher Bewegungen. Ihr Wert liegt darin, realistische Erwartungen für Ausmaß und Dauer zu setzen — nicht als eigenständiges Ein- oder Ausstiegssignal.
🧲 Modul 3 — Unterstützungs- & Widerstandsbereiche
⚙️ Wie erkennt er die Zonen?
Jedes Mal, wenn ein Wendepunkt bestätigt wird, zeichnet der Indikator eine horizontale Zone, wobei der ATR (Average True Range) verwendet wird, um die Dicke der Zone zu bestimmen. Widerstandszonen werden rot gezeichnet, Unterstützungszonen grün — beide mit zwei Deckkraftschichten, um visuelle Tiefe und Klarheit zu schaffen.
Die Zonen verhalten sich dynamisch: Schließt der Preis auf der anderen Seite der Zone, wird sie als „gebrochen“ markiert — wechselt zu einer gepunkteten Linie mit verringerter Deckkraft. Zonen verschwinden automatisch nach der Anzahl der Balken, die in „Zonenlebensdauer“ konfiguriert sind.
🚀 Wie man es benutzt
1
Bestätige den Trend: prüfe die Farbe und Richtung des Kanals. Der Winkel in Grad zeigt dir, wie stark der Trend ist — ein steilerer Winkel bedeutet mehr Momentum.
2
Lies den Preiszustand ab: das Info-Panel im Chart beschreibt in Echtzeit, ob der Preis sich innerhalb, im Ausbruch oder im Retest der Kanalgrenze befindet.
3
Bewerte die Projektion: der Kegel und die Zielbox geben eine Referenz, wo und wie weit sich der Preis bewegen könnte, basierend auf der historischen Mustersammlung, die während der Sitzung aufgebaut wurde.
4
Respektiere die Zonen: ungebrochene S/R-Boxen markieren Preisniveaus, an denen der Markt zuvor reagiert hat. Eine Zone, die nicht durchbrochen wurde, hat mehr Bedeutung als eine, die bereits durchbrochen wurde.
🖥️ Kompatibilität & Anforderungen
✅ cTrader✅ cAlgo API✅ Jedes Asset✅ Jeder Zeitrahmen✅ Preis-Overlay
Kein Internetzugang oder spezielle Berechtigungen erforderlich. Alle Berechnungen werden lokal mit den bereits in der Plattform verfügbaren Preisdaten durchgeführt.
⏱️ Für beste Ergebnisse auf Zeitrahmen von 15 Minuten oder höher verwenden. Bei sehr niedrigen Zeitrahmen (1–5 Minuten) kann Marktrauschen Wendepunkte mit geringer statistischer Zuverlässigkeit erzeugen, was die Qualität sowohl der S/R-Zonen als auch der Prognose verringert.
Zusammenfassung
Kundenbewertungen
5 | 0 % | |
4 | 100 % | |
3 | 0 % | |
2 | 0 % | |
1 | 0 % |


![„[Hamster-Coder] Moving Average MTF“-Logo](https://cdn.ctrader.com/image/webp/b11b98b1-194d-4b8e-b00e-d611826ad159_31226)


![„High-Low Divergence [Iridio Capital]“-Logo](https://cdn.ctrader.com/image/webp/443c4661-7abb-40f1-842f-4b6ec560649b_40914)


