الوصف
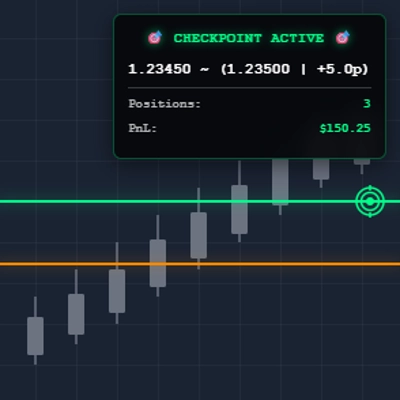
مؤشر نقطة التحقق
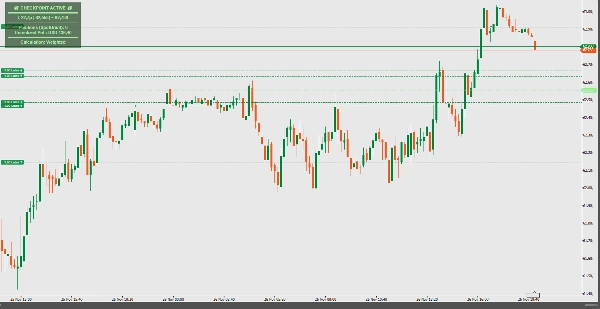
حاسبة السعر المتوسط الذكية لإدارة المواقع المتعددة. تعرض مستويات التعادل في الوقت الحقيقي مع تغذية بصرية ديناميكية. مثالية للمتداولين الذين يديرون عدة مداخل عبر أي أداة.
الميزات الرئيسية:
- حساب المتوسط المرجح في الوقت الحقيقي
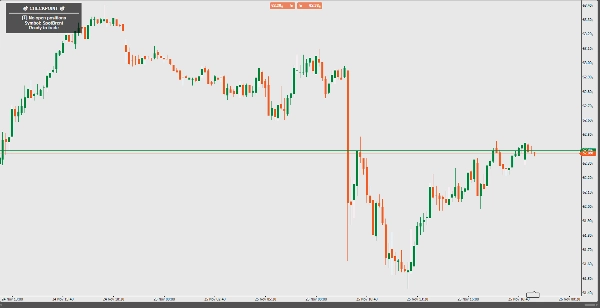
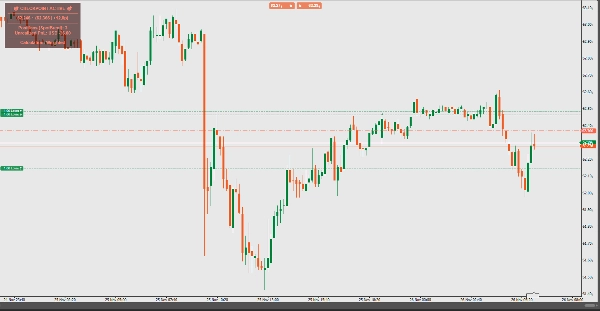
- عرض ذكي للخط (يظهر فقط مع وجود موقعين أو أكثر)
- تلوين ديناميكي بناءً على الأرباح والخسائر (أخضر/أحمر/أبيض)
- مؤشر القوة بالنقاط من السعر الحالي
- لوحة معلومات نظيفة واحترافية
- أداء بدون تأخير
كيف يعمل:
يحسب تلقائيًا متوسط سعر موقعك باستخدام إما طريقة المتوسط المرجح بالحجم أو المتوسط البسيط. يعرض المؤشر خطًا أفقيًا واضحًا يحدد نقطة التعادل الخاصة بك عندما يكون لديك مواقع متعددة، مما يساعدك على اتخاذ قرارات تداول مستنيرة بناءً على صحة موقعك الإجمالية.
مثالي لـ:
- المتداولين الذين يوسعون أو يقلصون مواقعهم
- إدارة المحافظ عبر الأدوات
- إدارة المخاطر وتحديد وقف الخسارة
- تصور نقطة توازن حساب التداول الخاص بك
ببساطة طبقها على أي مخطط ودع Checkpoint يتولى الباقي - نقطة التحقق لتداولك أصبحت بسيطة!
الملخص
ملف تعريف المؤشر
تقييمات العملاء
0.0
التقييمات: 0
تقييمات العملاء
لا توجد تقييمات لهذا المنتج حتى الآن. هل جرَّبته بالفعل؟ كن أول من يخبر الآخرين!
مناقشة
الأسئلة الشائعة
BTCUSD
Forex
Indices
EURUSD
Commodities
GBPUSD
NZDUSD
Crypto
Stocks
XAUUSD
NAS100
USDJPY
يتم توفير المنتجات المتاحة من خلال cTrader Store، بما في ذلك روبوتات التداول والمؤشرات والإضافات، من قبل مطوري الطرف الثالث وإتاحتها لأغراض الوصول المعلوماتي والفني فقط. cTrader Store ليس وسيطًا ولا يقدم نصائح استثمارية أو توصيات شخصية أو أي ضمان للأداء المستقبلي.
المزيد من هذا المؤلف


السعر
منذ 28/12/2024
54
التثبيتات المجانية