설명
지능형 macd 단계 감지기/예측 모델 시스템 부분 2 중 3
PERFECT STORM DAY TREND CLASSIFIER™
정밀한 시장 구조. 실시간 추세 인텔리전스. 돌파 인식.
전문 제품
Day Trend Classifier™는 명확성, 정밀성 및 실시간 인트라데이 추세 행동 통찰력을 요구하는 트레이더를 위해 설계된 차세대 시장 구조 엔진입니다. 적응형 변동성 분석, 기울기 기반 추세 감지 및 지능형 돌파 매핑을 기반으로 구축된 이 지표는 원시 가격 움직임을 깔끔하고 표현력 있으며 실행 가능한 시각적 내러티브로 변환합니다.
당신이 인트라데이, 스윙 또는 알고리즘 트레이딩을 하든, Day Trend Classifier™는 모든 트레이더가 필요로 하는 한 가지를 제공합니다:
지금 시장이 무엇을 하고 있는지 — 그리고 다음에 무엇을 준비하고 있는지 즉각적으로 인식할 수 있습니다.
핵심 기능
실시간 추세 상태 감지
이 지표는 시장 구조를 지속적으로 평가하며 하루의 행동을 네 가지 직관적인 체제로 분류합니다:
상승 추세
하락 추세
횡보 / 중립
축적 단계 (확장 전 저범위 압축)
깔끔한 차트 내 라벨이 항상 정보를 제공합니다.
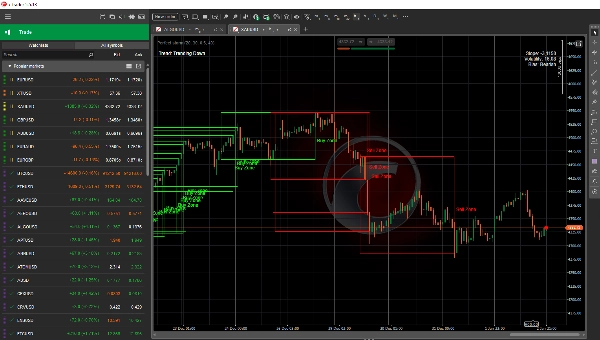
표현력 있는 시각적 피드백
당신의 차트가 전술 대시보드가 됩니다:
깜박이는 추세 점
강세 추세에는 라임색
약세 추세에는 빨간색
축적에는 노란색
중립에는 회색
추세 미터 바
추세 모멘텀과 명확성을 시각적으로 전달하는 동적 강도 바.
정보 블록
기울기, 변동성 및 방향성 편향을 실시간으로 표시합니다.
이는 단순한 데이터가 아니라 시각화된 시장 인텔리전스입니다.
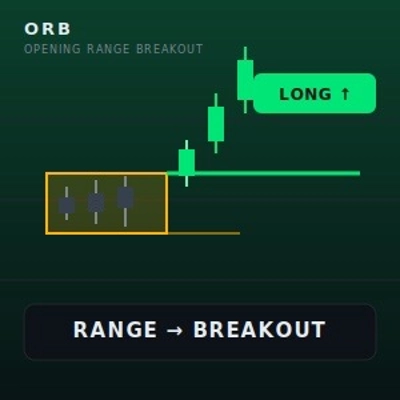
지능형 돌파 구역 매핑
Day Trend Classifier™는 돌파 조건을 식별하고 자동으로 다음을 그립니다:
상향 돌파 시 매수 구역
하향 돌파 시 매도 구역
각 구역에는 다음이 포함됩니다:
반투명 음영 영역
굵은 구조적 경계
명확한 “매수 구역” 또는 “매도 구역” 라벨
미래 재테스트를 위한 전방 투영 확장
이 구역들은 움직임이 시작된 위치와 높은 확률의 재테스트가 자주 발생하는 위치를 보여줍니다.
이것이 효과적인 이유
하루의 추세를 한눈에 이해
확장 전에 축적을 식별
돌파 기원과 재테스트 구역을 자동으로 확인
실시간 변동성 및 기울기 지표를 사용하여 자신 있게 거래
모든 시간대, 모든 심볼, 모든 시장에서 작동
깔끔하고 표현력이 뛰어나며 전문적인 작업 흐름에 적합
이것은 또 다른 이동 평균 지표가 아닙니다.
인트라데이 혼란을 명확성으로 바꾸는 시장 구조 엔진입니다.
누구를 위한 것인가??.....
실시간 추세 인식이 필요한 인트라데이 트레이더
과매도 진입을 피하고자 하는 스윙 트레이더
깔끔하고 결정론적인 논리가 필요한 알고리즘 트레이더
구조, 구역 및 변동성에 의존하는 가격 행동 트레이더
시장의 진정한 의도를 이해하고자 하는 모든 사람
노트
이것은 시스템 2/3의 일부이며, 전체 성능을 위해서는 3개 모두가 필요합니다
추가 파트 4도 구입할 수 있으며, 가격 행동을 기반으로 한 고급 지지 및 저항 수준을 제공합니다
⭐PERFECT STORM DAY TREND CLASSIFIER™
명확하게 하루를 거래하세요. 자신 있게 추세를 거래하세요.