

설명
가장 검증된 데이 트레이딩 세트업, 차트에서 완전 자동화되었습니다.
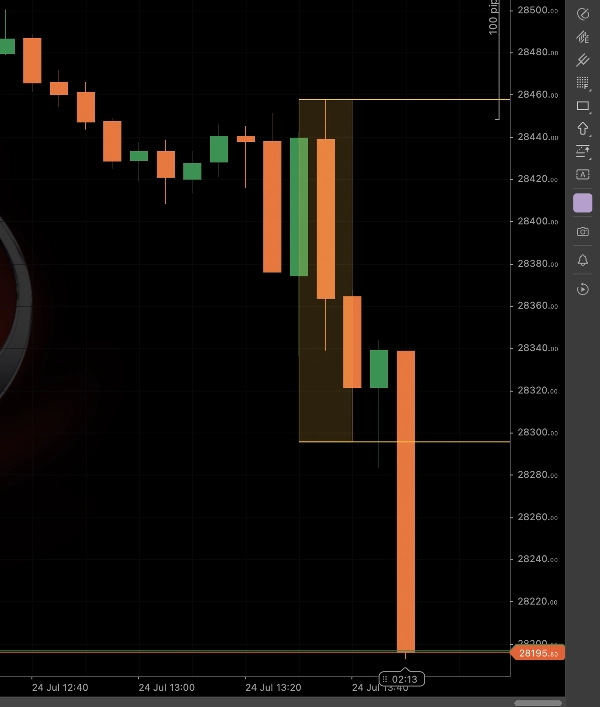
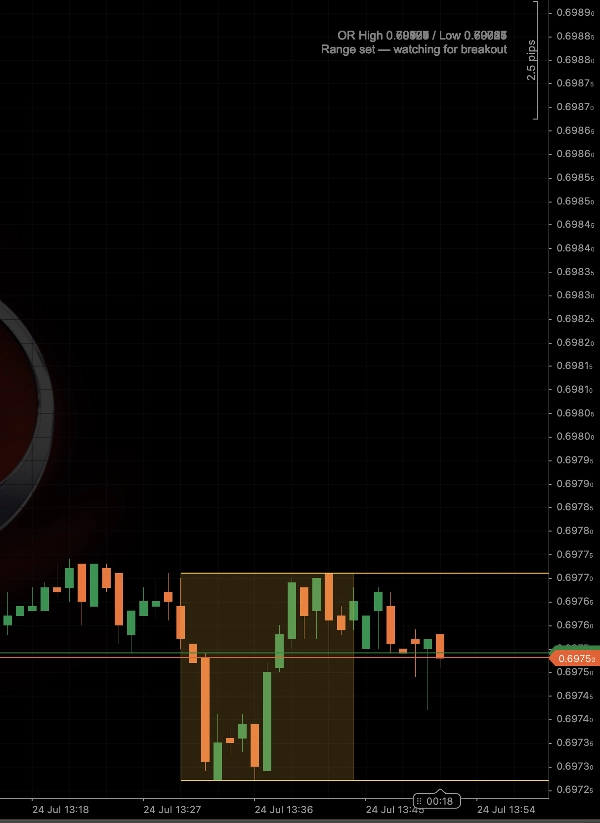
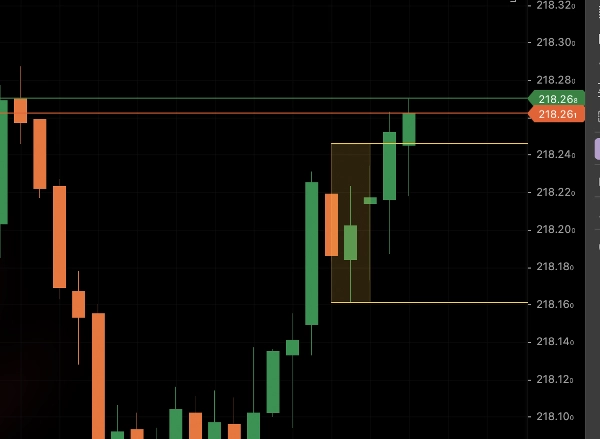
Opening Range Breakout은 세션 시작 후 첫 몇 분간의 고가와 저가를 표시한 다음, 가격이 단순히 꼬리로 수준을 넘는 것이 아니라 실제 돌파를 확정하는 순간을 알려줍니다.
분석 내용:
- Opening Range — 세션 시작 직후 설정 가능한 시간대의 고가/저가 (기본값: 9:30 ET, 15분 — 고전적인 NYSE 오픈 ORB)
- Breakout Confirmation — 전체 캔들 종가 가 범위를 넘어설 때만 작동하며, 단순히 꼬리로 넘었다가 되돌아오는 가짜 돌파를 걸러냅니다.
- Volume Surge Filter — 선택적으로 돌파 캔들의 거래량이 최근 평균의 배수를 초과해야 하므로, 노이즈가 아닌 확신 있는 거래를 할 수 있습니다.
읽는 방법: 범위는 형성되는 동안 음영 처리된 상자와 두 개의 확장선으로 표시됩니다. 유효한 돌파가 확인되는 즉시 전체 상자와 두 선이 굵은 녹색(롱) 또는 빨간색(숏)으로 바뀌며, 신호 캔들 위에 명확한 "LONG BREAKOUT" / "SHORT BREAKDOWN" 태그가 표시됩니다. 또한 전체 차트 기록에 걸쳐 실행되므로 이전 세션의 범위가 어떻게 전개되었는지 정확히 스크롤하여 확인할 수 있습니다.
주요 설정: OR 시작 시간(ET), OR 지속 시간(분), 거래량 배수, 선 확장 길이, 그리고 음영 상자 토글.
적합 대상: 정의된 세션 오픈이 있는 주식, 지수 또는 선물의 낮은 타임프레임(1~15분) 내 데이 트레이더 — 이는 소매 데이 트레이딩에서 가장 기계적이고 규칙 기반의 세트업이며, 이 도구는 수동 범위 그리기와 돌파 확인 작업을 완전히 제거합니다.
요약
AI summary
Opening Range Breakout is an automated indicator designed for intraday traders using lower timeframes (1–15 minutes) on stocks, indices, or futures with defined session opens. It automatically plots the high and low of a configurable opening range period (default 9:30 ET for 15 minutes) on the chart. The tool identifies and signals confirmed breakouts by detecting a full candle close beyond the range, filtering out false breakouts caused by wick pokes. An optional volume surge filter requires breakout candles to exceed a set multiple of recent average volume, emphasizing trading conviction. The indicator visually represents the opening range as a shaded box with extending lines, which turn bold green for long breakouts or red for short breakdowns upon confirmation, accompanied by clear breakout tags on the signal candle. It operates across the entire chart history, allowing review of past sessions. Key adjustable settings include the opening range start time, duration, volume multiplier, line extension length, and shaded box toggle. This indicator automates the classic 9:30 Opening Range Breakout setup, removing manual range drawing and breakout identification.
지표 프로필
고객 리뷰
0.0
리뷰: 0
고객 리뷰
이 상품에 대한 리뷰가 아직 없습니다. 이미 사용해 보셨나요? 다른 사람들에게 가장 먼저 소개해 주세요!
상담
자주 묻는 질문(FAQ)
Fibonacci
Key Levels
AI-assisted
Volume
Market Structure
Liquidity Grab
Support & Resistance
트레이딩 봇, 지표, 플러그인 등 cTrader Store에서 제공되는 상품은 제3자 개발자에 의해 제공되며, 이는 단순히 정보 및 기술적 접근을 목적으로 제공된 것입니다. cTrader Store는 중개인이 아니며, 투자 조언, 개인별 추천 또는 향후 성과에 대한 어떠한 보장도 제공하지 않습니다.
이 작성자의 상품 더 보기





























가격

가입일 07/05/2026
5
판매
63
무료 설치