설명
매트릭스 트렌드 히트맵 프로
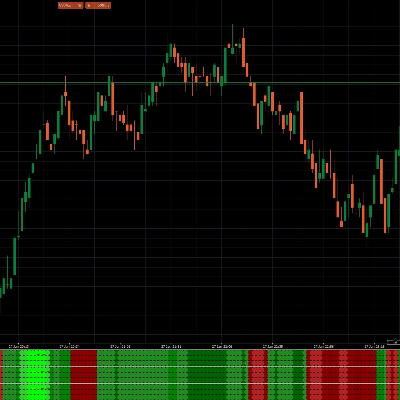
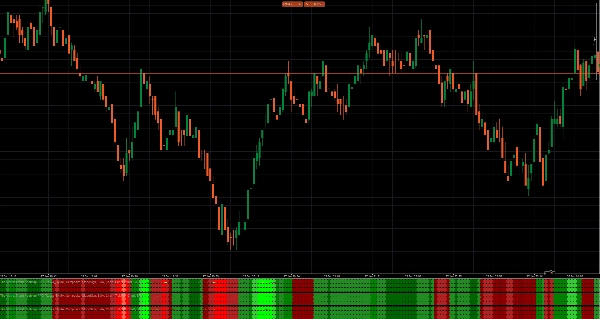
이 지표는 다중 시간대 트렌드 및 강도 엔진으로, 시장이 강세장(녹색), 약세장(빨간색), 또는 중립인지 한눈에 보여주며, 그 방향성 편향이 얼마나 강한지를 나타냅니다.
단일 “트렌드 라인”에 의존하는 대신, EMA 구조 + 기울기 방향 + 변동성(ATR) + 일관성을 하나의 깔끔한 복합 강도 점수로 결합합니다. 결과적으로 빠른 차트에서 특히 방향에 대한 더 부드럽고 신뢰할 수 있는 판독값을 제공하며, 횡보 구간에서 발생하는 잦은 변동을 줄여줍니다.
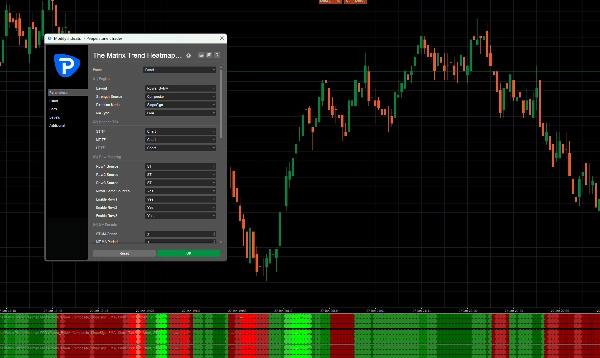
기본 설정 (틱 30 / 1분)
기본 설정은 틱 30 및 1분 차트에 맞게 특별히 조정된 값입니다. 이 값들은 임의가 아니며, 속도 + 안정성의 균형을 맞추기 위해 완전한 세트로 보정되어, 지표가 실제 트렌드 변화에 빠르게 반응하면서 미세 잡음을 필터링합니다.
기본 하이라이트:
- MA 유형: EMA
- 방향 모드: SlopeSign
- ST / MT / LT 타임프레임: 차트 (정렬된 논리, TF 불일치 없음)
- ST / MT / LT MA 기간: 3 (빠른 반응, 틱30/1분에 이상적)
- ATR 기간: 14 (안정적인 변동성 정규화)
- 기울기 조회 기간: 3 (과도한 깜박임 없이 반응적)
- 일관성 바: 12 (빠른 차트에서 미세 횡보 필터링)
- 최대 강도: 2 (시각적 표현을 깔끔하고 통제된 상태로 유지)
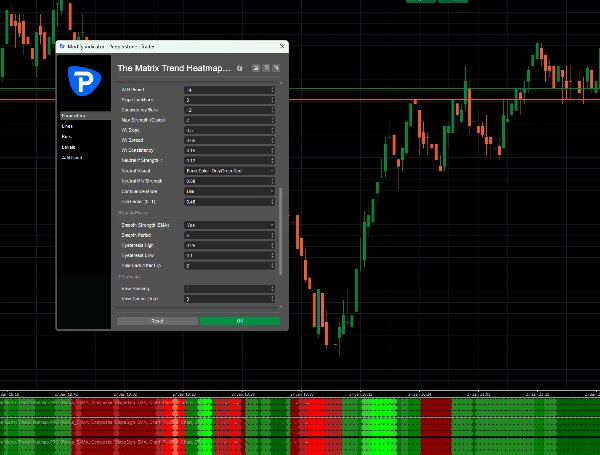
복합 가중치 (기본값):
중립 임계값 (기본값):
- 강도 < 0.12
강도가 이 수준 아래로 떨어지면, 지표는 의도적으로 시장을 “우위 없음”으로 간주하여 횡보 구간에서 과도한 거래를 피하도록 도와줍니다.
지표가 하는 일
1) 방향 (SlopeSign)
방향은 선택된 이동평균선(기본값: EMA)의 기울기(각도)에 의해 결정됩니다.
- 양의 기울기 → 상승 추세 (녹색)
- 음의 기울기 → 하락 추세 (빨간색)
2) 복합 강도 (단순한 “트렌드 켜기/끄기”가 아님)
색상과 강도는 방향뿐만 아니라 트렌드 강도를 나타냅니다. 강한 트렌드는 더 확고하고 안정적으로 보이며, 약한 트렌드는 중립 쪽으로 희미해집니다.
3) 다중 시간대 프레임워크 (ST / MT / LT)
이 지표는 여러 “시간대”(단기 / 중기 / 장기)를 지원합니다. 조정된 기본값에서는 차트 타임프레임에 매핑되어 틱 30 / 1분 차트에서 일관되고 예측 가능한 동작을 유지합니다.
유용한 이유 (실제 거래 가치)
대부분의 트렌드 지표는 두 가지 방식 중 하나로 실패합니다:
- 너무 느리다 (확인 지연), 또는
- 너무 시끄럽다 (횡보 시장에서 잦은 변동).
이 엔진은 다음을 결합하여 이를 해결합니다:
- 기울기 (방향 + 모멘텀)
- 스프레드 (움직임 압력/공간)
- 일관성 (트렌드가 얼마나 깔끔하게 지속되는지)
모두 ATR로 정규화되어, 특히 빠른 차트에서 다양한 변동성 환경에서도 동작이 더 안정적입니다.
사용 방법 (간단하고 효과적)
트렌드 필터 (주요 사용법)
- 엔진이 녹색일 때만 롱 포지션 설정을 찾으세요.
- 엔진이 빨간색일 때만 숏 포지션 설정을 찾으세요.
- 중립 상태에서는 기다리거나 추가 확인과 더 엄격한 목표로만 거래하세요.
진입 타이밍
자신만의 트리거(되돌림, 돌파, 패턴 등)를 사용하되, 지표가 방향성 맥락과 강도를 정의하도록 하세요.
횡보 회피
빈번한 중립/약한 단계 = 횡보/우위 없음.
이는 지표가 자본 보호, 규모 축소 또는 구조를 기다리라는 신호입니다.
안전한 조정 (튜닝을 깨지 않고)
더 차분하게 (덜 민감하게) 만들고 싶다면:
- 기울기 조회 기간을 3에서 4/5로 늘리세요.
- 일관성 바를 12에서 14/16으로 늘리세요.
더 빠르게 만들고 싶다면:
팁: 한 번에 하나의 매개변수만 변경하세요. 기본값은 균형 잡힌 시스템으로 조정되어 있습니다.
한 줄 요약
빠르고 ATR 정규화된 EMA 기울기 트렌드 엔진으로, 복합 강도 점수(기울기 + 스프레드 + 일관성)를 갖추고 있으며, 틱 30 및 1분 차트에 기본 조정된 노이즈를 줄이고 높은 우위의 트렌드 조건을 강조하도록 설계되었습니다.


